
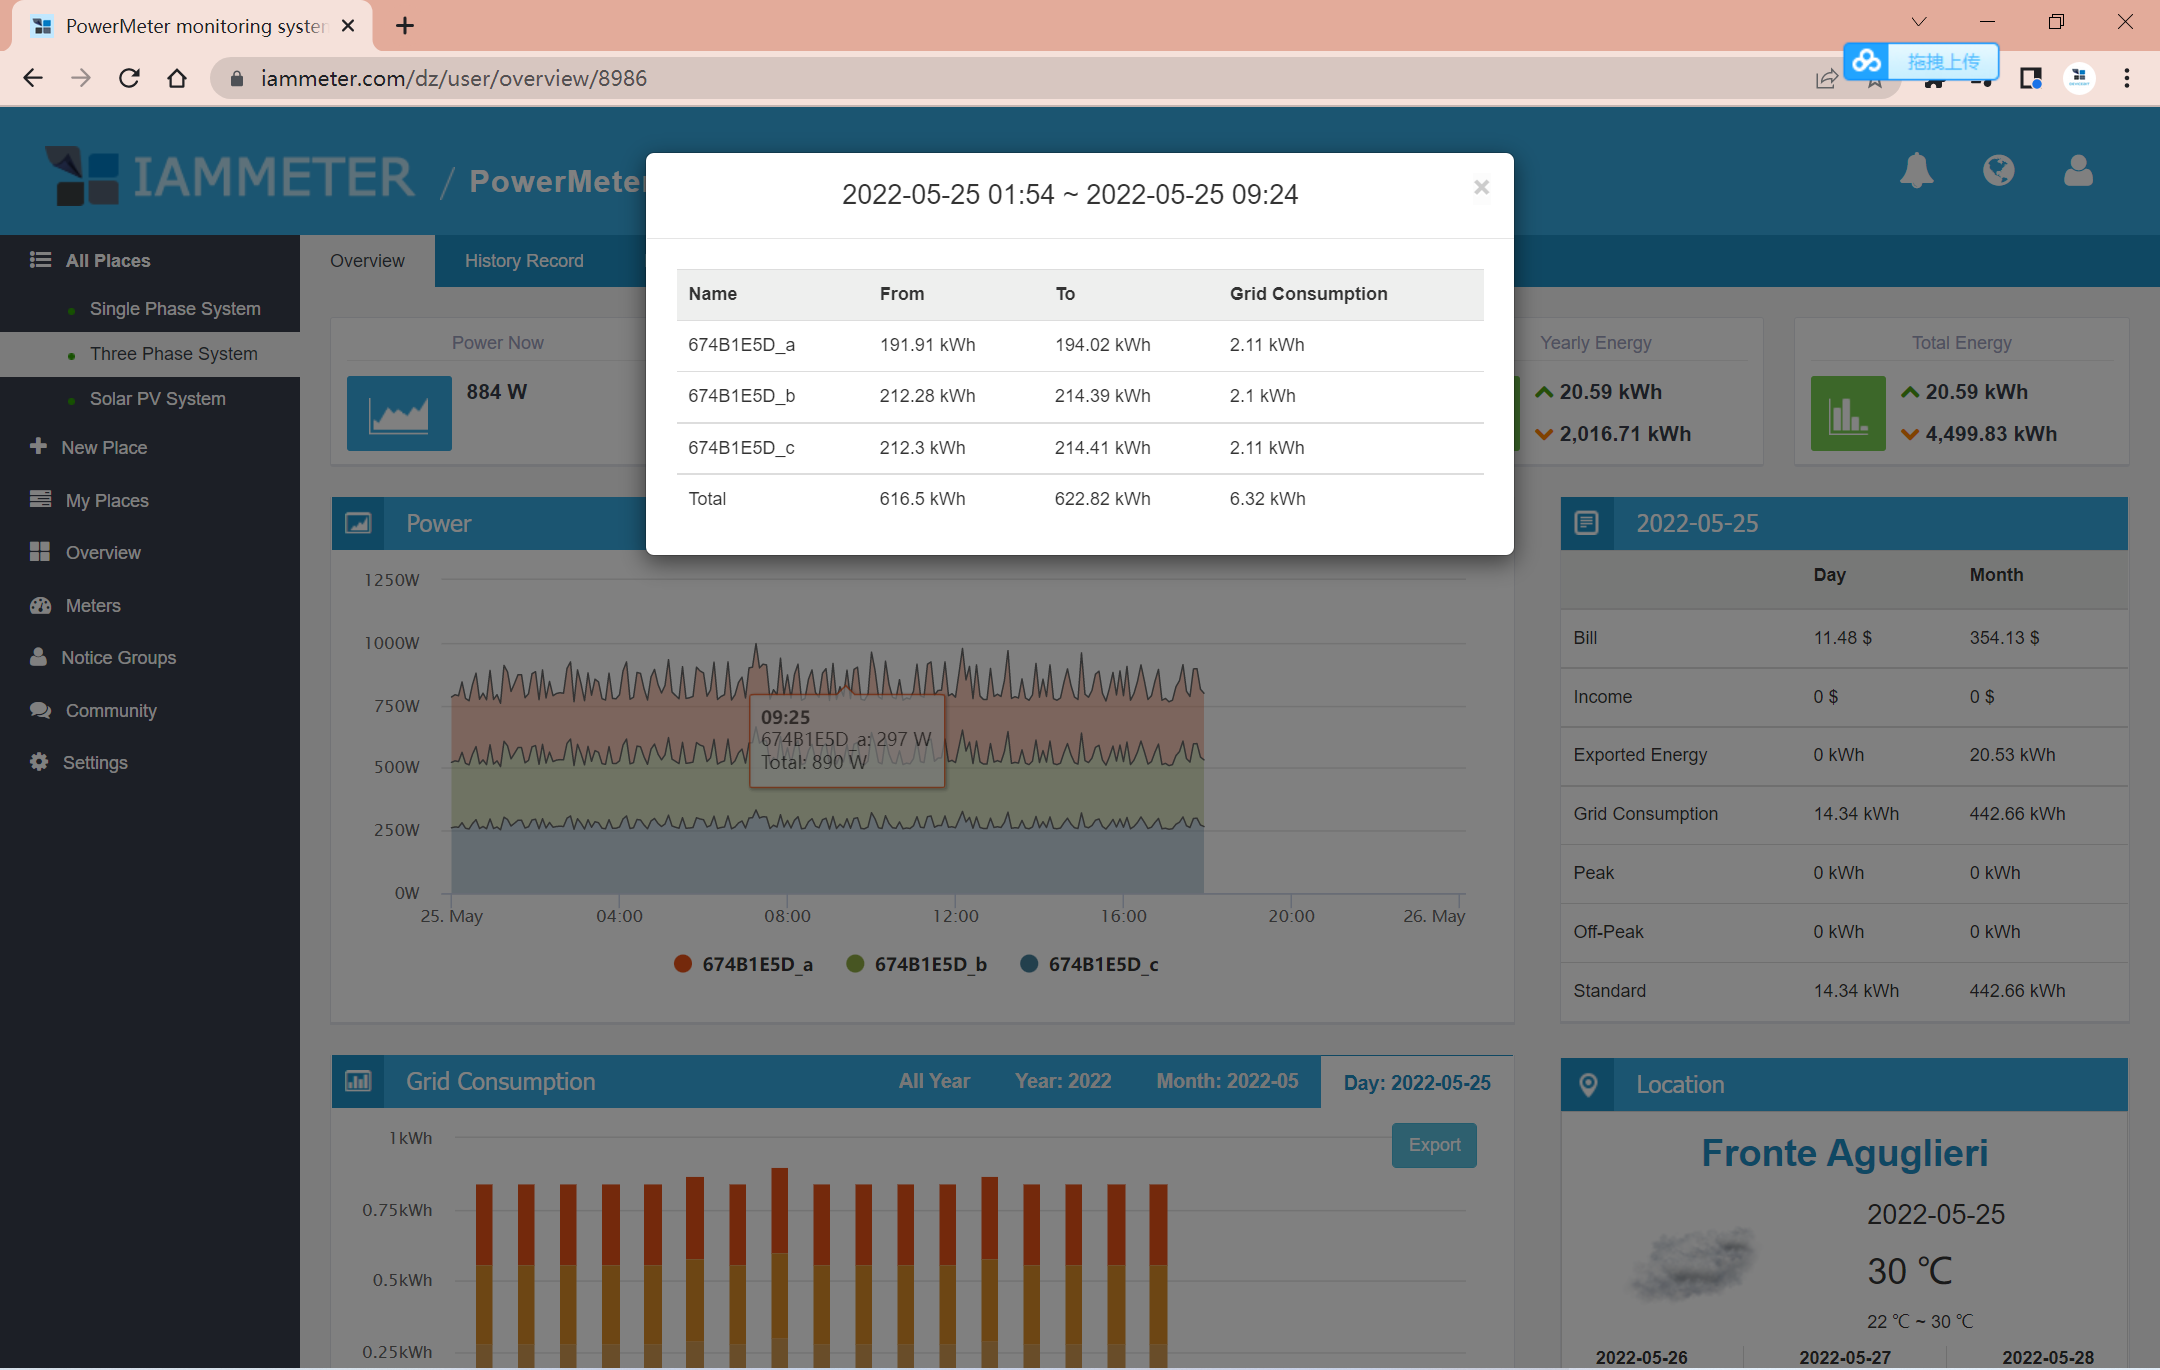
New feature:Analyze the energy difference within the selected time interval from the power chart
Video show: https://www.youtube.com/watch?v=O1P0CxKV21I
1 press "Alt" key
2 select the time interval in the power chart.
I find an easy way to activate this dialog.
Just select the graph first, then press the Alt button before releasing the mouse button. 😄
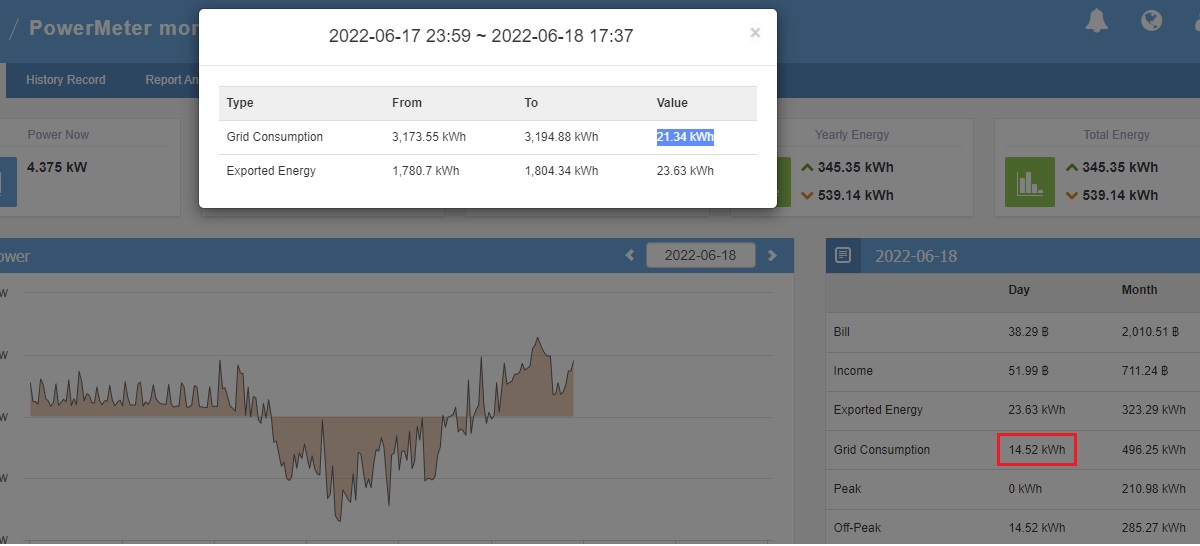
When I selected the whole graph, I got different values of the Grid Consumption, but the Exported Energy is ok.

I wonder this is a bug.
Hi:
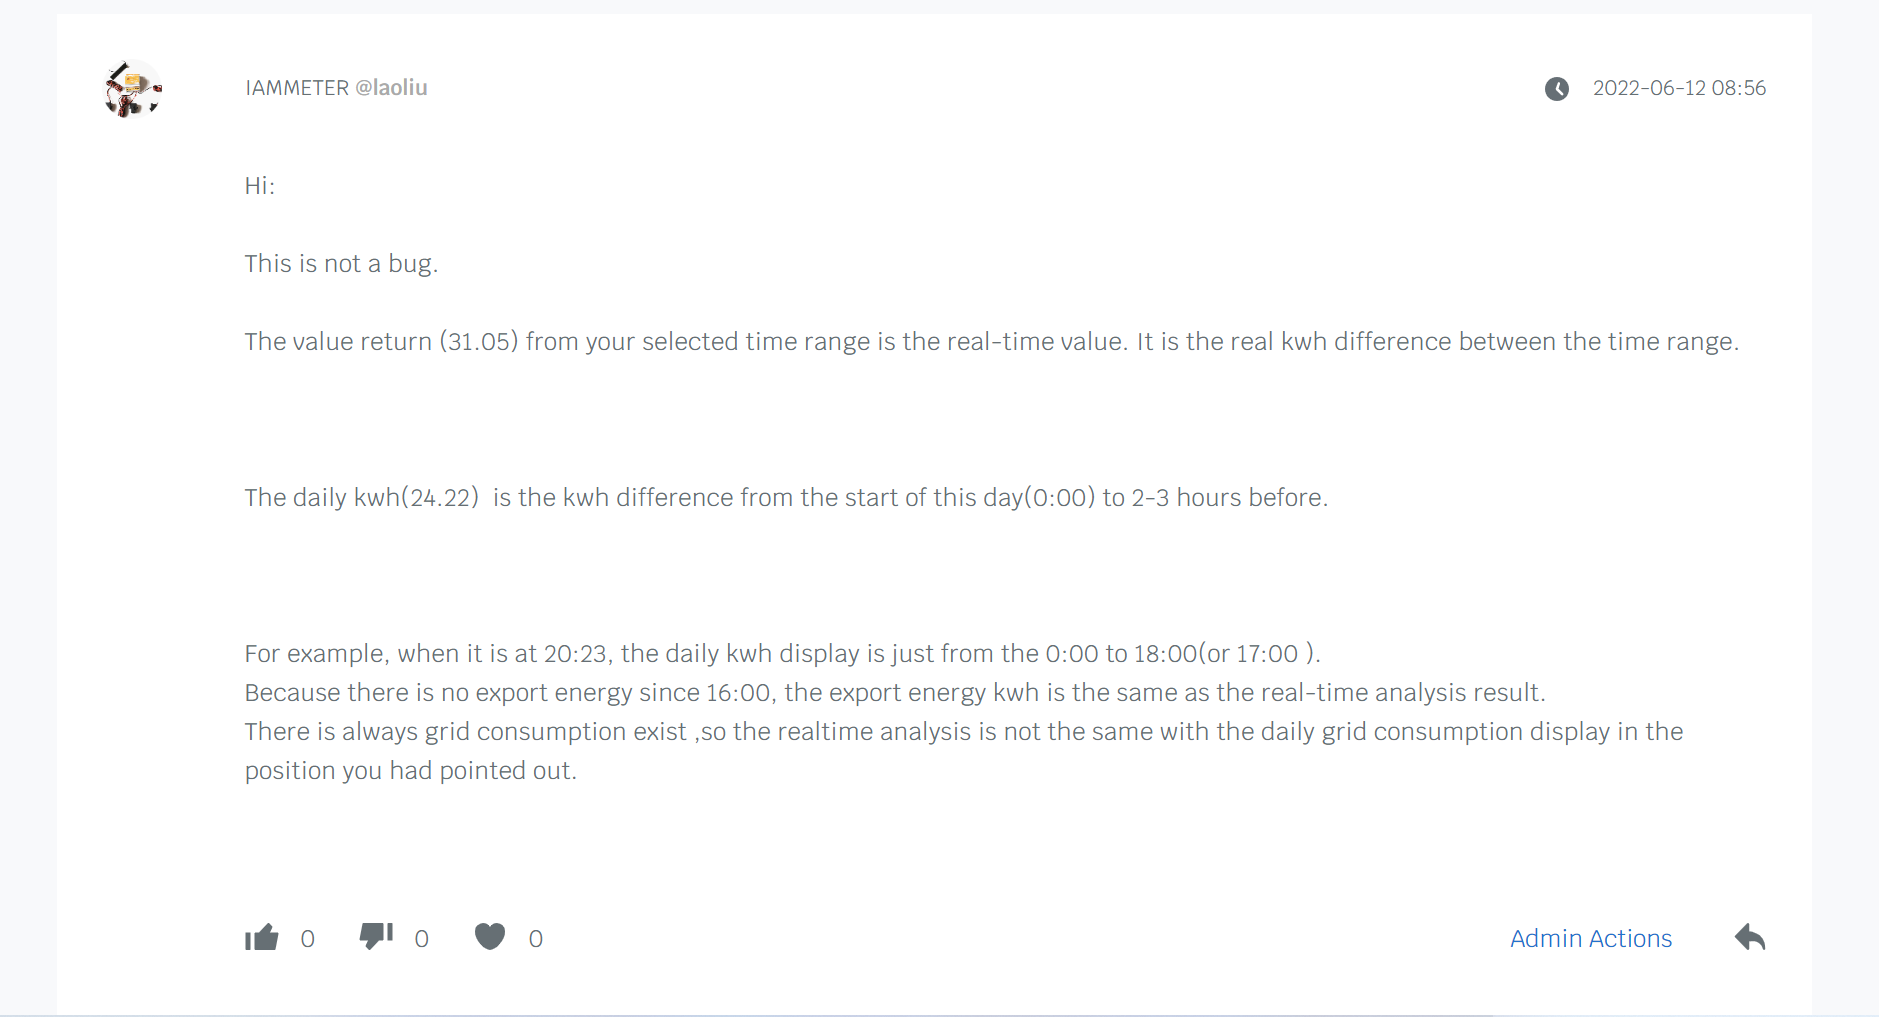
This is not a bug.
The value return (31.05) from your selected time range is the real-time value. It is the real kwh difference between the time range.
The daily kwh(24.22) is the kwh difference from the start of this day(0:00) to 2-3 hours before.
For example, when it is at 20:23, the daily kwh display is just from the 0:00 to 18:00(or 17:00 ).
Because there is no export energy since 16:00, the export energy kwh is the same as the real-time analysis result.
There is always grid consumption exist ,so the realtime analysis is not the same with the daily grid consumption display in the position you had pointed out.
The app of IAMMETER has just been upgraded to provide the same features as the web system
The app of IAMMETER has just been upgraded to provide the same features as the web system
I found different calculations when selecting the whole chart, 21.34 vs 14.52 (the dashboard's).
Hi, you asked the same question on this topic.
And I also reply to you on this topic.
Update:
Add "special load" information in this analysis
https://imeter.club/topic/364#add-special-load-information-in-selected-times-analysis