Problem with data interpretation in the Iammeter cloud chart.
Hi, I have had a second meter for several days that is connected to the PV inverter. When the weather is clear, everything is fine. Also when it is cloudy, the display is correct.
However, when it is alternately sunny or there are clouds, the graphs show a false load. The load values are negative, which is obviously wrong.
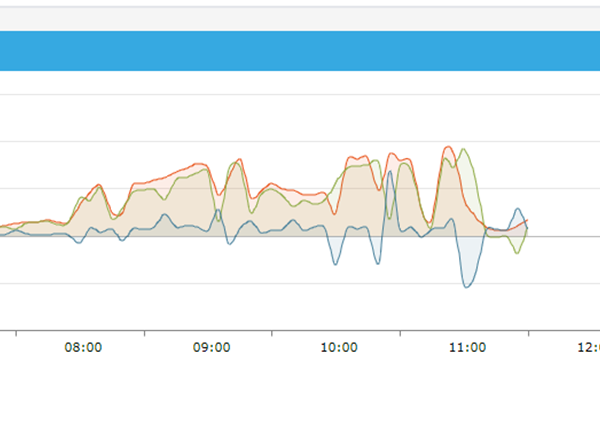
This is because the meters send data at different times and the weather changes during this time.
Can you improve it? How?
I am not able to buy a third meter, just so that the same meter works on each phase (from grid, inverter, load).
Maciej

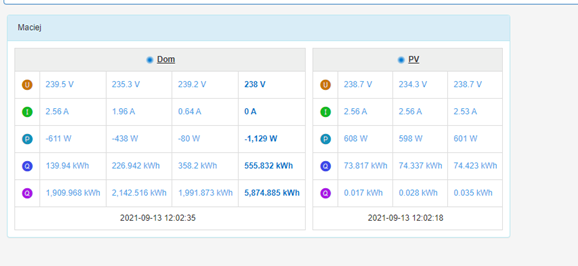
The load power is calculated by IAMMETER-cloud , the formula is as below
load power= grid power(import power:positive, export power:negative)+ inverter power.
Because both grid power and inverter power are instant reading, two meters can not sample totally synchronized.
The meter samples each minute, So there will be a maximum of 1 min phase difference when calculated the load power.
When the grid power or inverter power varies a lot during 1 min, it will affect the load power calculation.
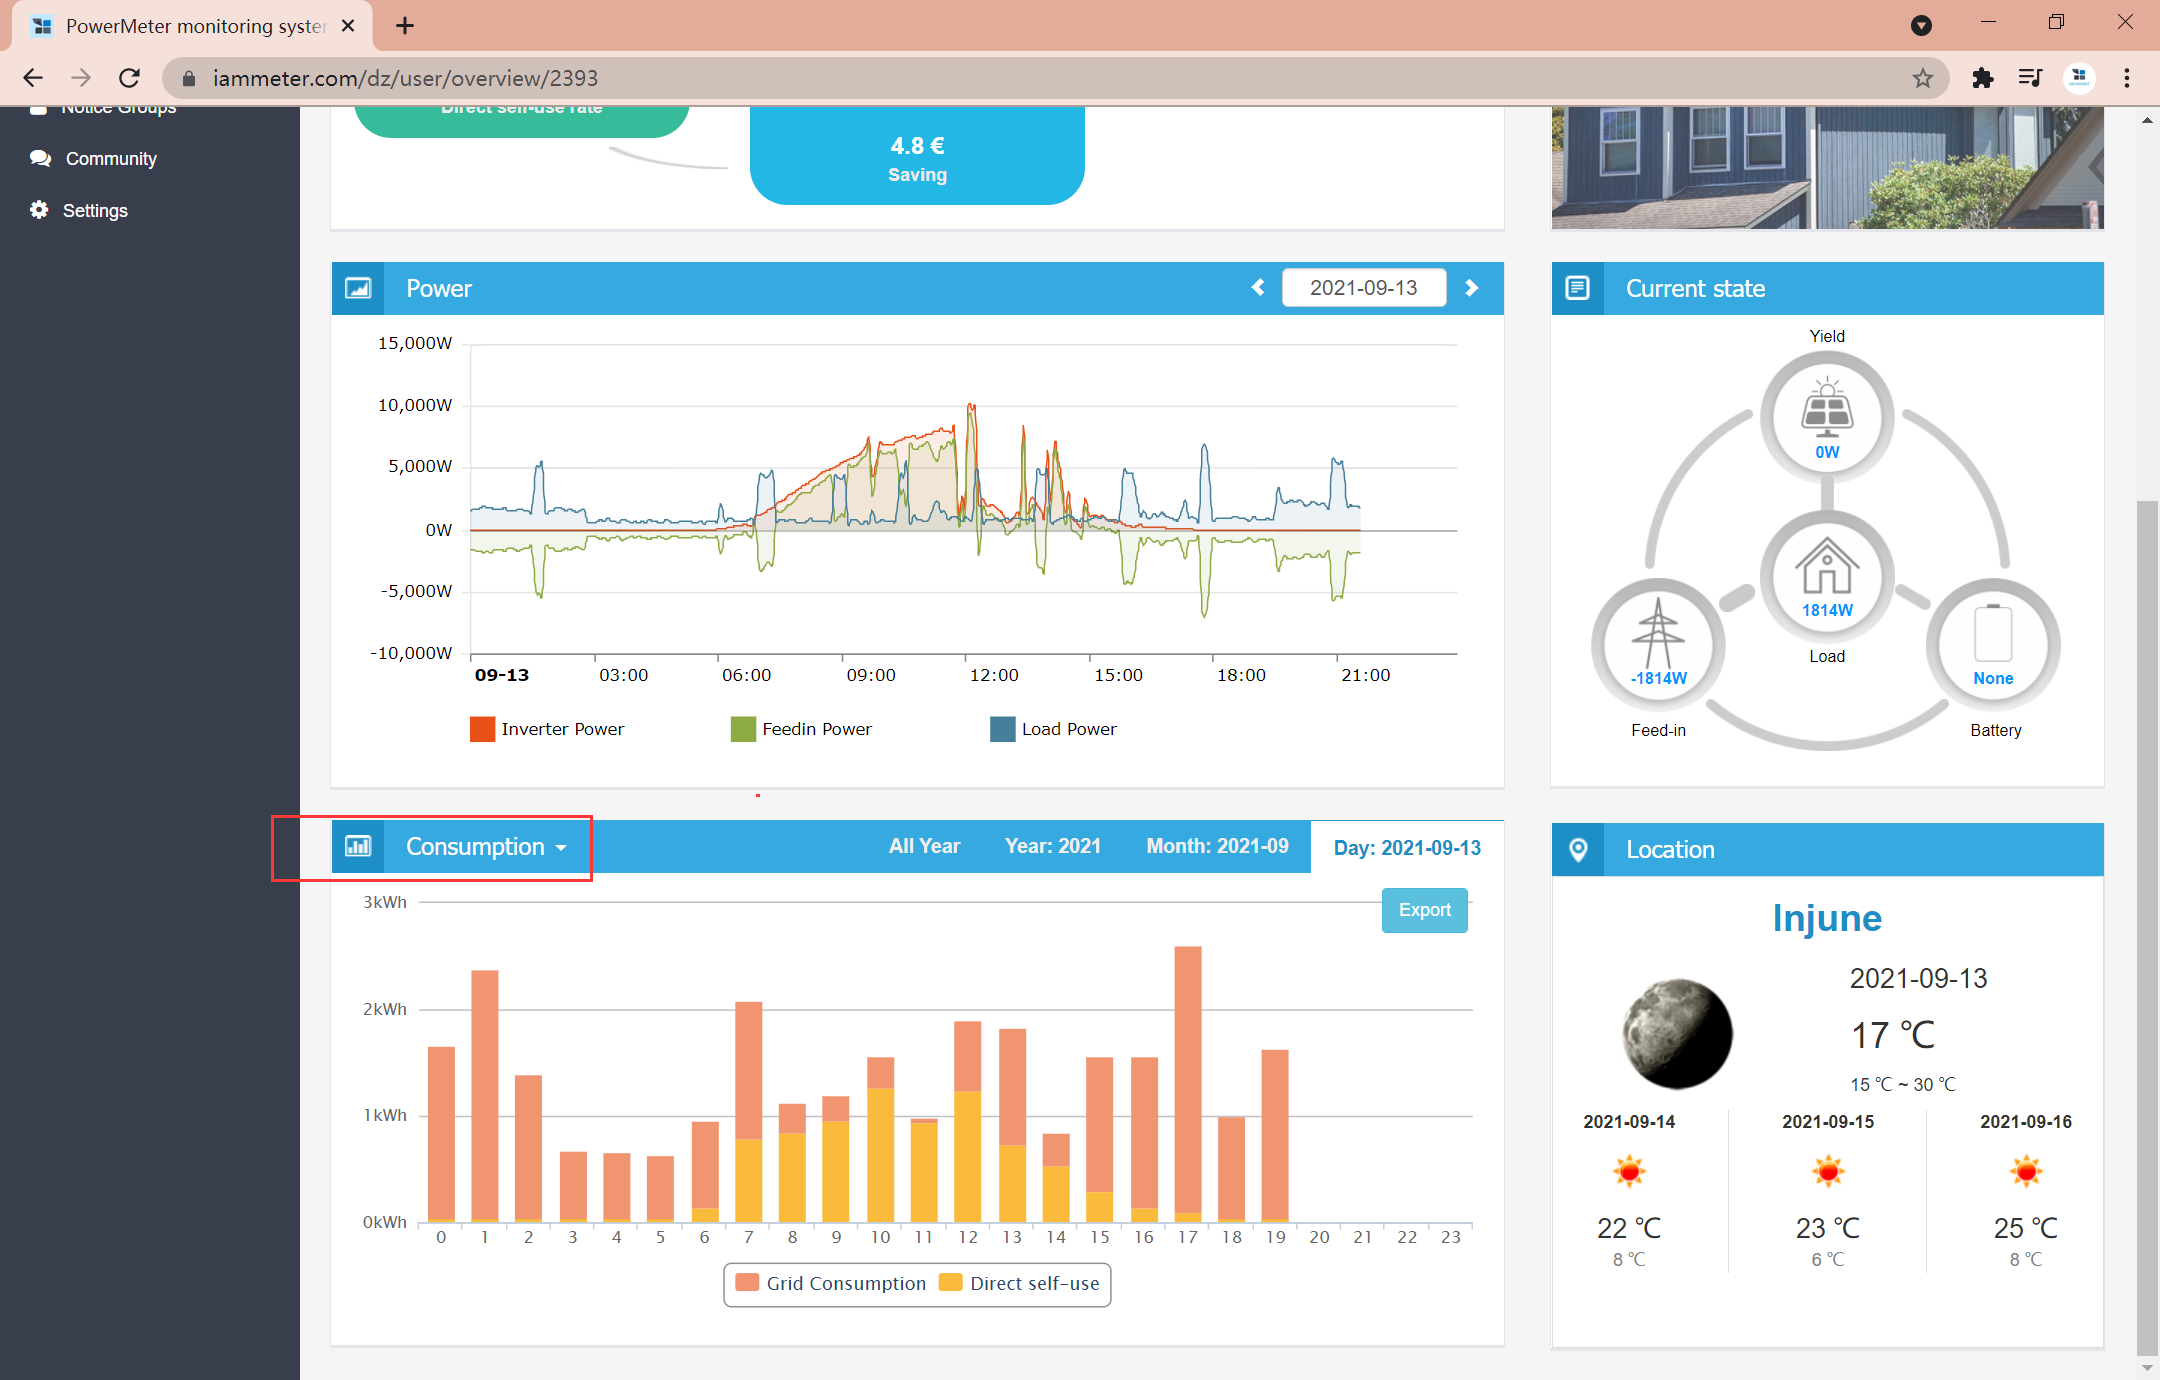
The load power is only a trend parameter, we just use it as a trend display on the overview page, it will not be stored, you can even close the display of load power on the overview page.
Comparing with the instant load power, the energy value is an accumulated parameter, it will be affected less by the possible 1min sample phase difference.
You can use the consumption graph(below) to analyze your load, it will be accurate.
Thanks for the answer.
I know that the accumulated power will be calculated correctly.
But the graph looks very strange.
Maybe change the data transfer frequency to every 6 seconds?
Now the maximum time difference is 30 seconds.
ps.
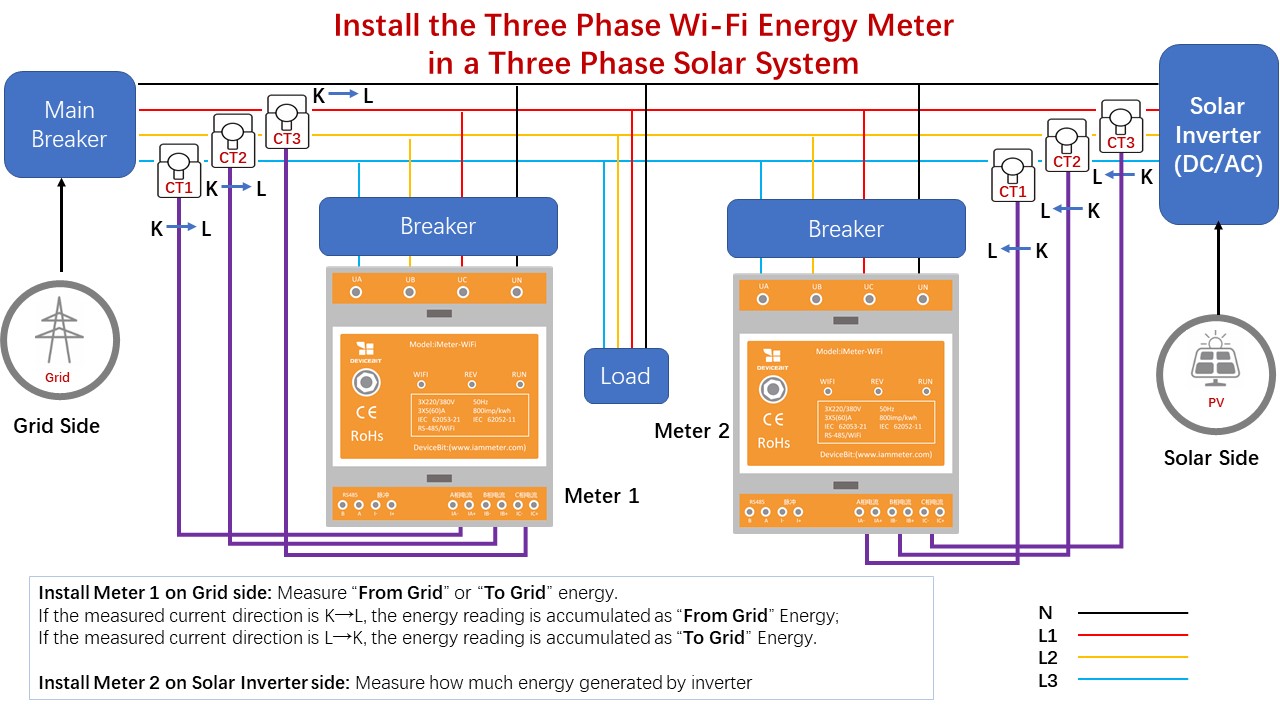
The counters are connected as shown in the picture.
Second question.
Which readings are taken for the chart?
The first of every fifth started minute?
For example 10:15:12 instead of 10:14:12 or 10:16:12?
Hi,
The sampling logic uses the first data of each five minutes.
The overview page displays the data according to the above logic.
The overview page does the addition of grid power and inverter power to get the load power.
The load power is only displayed in the chart of overview, it is not read or write to the database.
It is only a trend display, You can close the display of load power if you mind about the synchronized problem.
In fact, when we decided to add the load power display, we have discussed whether we should add the load power display in the chart and whether we should add some optimization (remove the value below zero) of the load power display.
The result of the discussion is to let the customer decide by themselves.(you can close the load power display if you mind the synchronization problem)
For example 10:15:12 instead of 10:14:12 or 10:16:12?