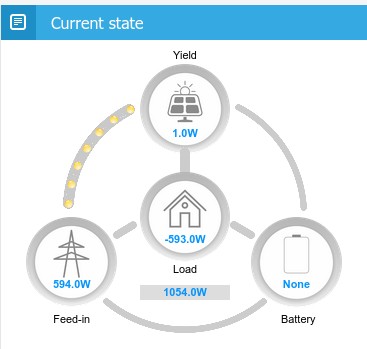
Current state diagram
I don't understand the current state diagram. The diagram shows energy being exported from the solar panels into the grid. But what is meant by "yield"? What does the 1.0W under the solar panel symbol mean, when I can see the panels are generating 1.068kW?

My setup. WEM3080T in a single phase environment. CT a is connected across the grid power, CT b is connected across the load, currently only measuring the 7kw car charger circuit ( not operating at the time of this snapshot) and CT c is across the solar panel input to the switchboard. I believe I defined the three inputs as described above, but there appears to be no way to display these settings, nor the ability to change them.
So, overall, I cannot relate the graphs and the diagram to what I see when looking at the inverter state.
1 about the special load https://imeter.club/topic/364?sort=default
2 this is the active power introduction about different type (inverter power ,grid power ,feedin power)
https://www.iammeter.com/docs/active-power#3-different-active-power
This is an introduction to how to set IAMMETER-cloud when you use a 3 phase meter to monitor a 1phase grid and 1phase inverter

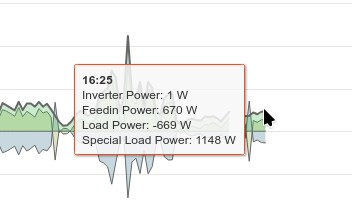
Here is the values from the graph at about the same time. What is special load power? Its value seems to be the solar panel output watts.
Thanks for the links.
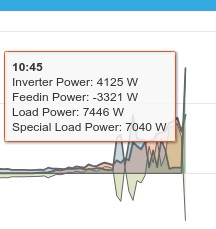
After reading the linked pages I found where the 3 input definitions are set. I had them the wrong way round. After placing the inverter and load on the actual matching inputs, the graph is now showing what I expected. Special load is now showing as 7.04kW, and Inverter power also matches the inverter reporting.
This topic can now be closed.

