The Iammeter Power Meter is reporting total Minus (export) Consumption and Plus (Import) Consumption and not Net Consumption, See Graph..
I Shows a total daily use of 10.28kwh and an Export of 5.12kwh, which is clearly not the case when you look a the flat line graph.
The Image below is the Red Phase (A)
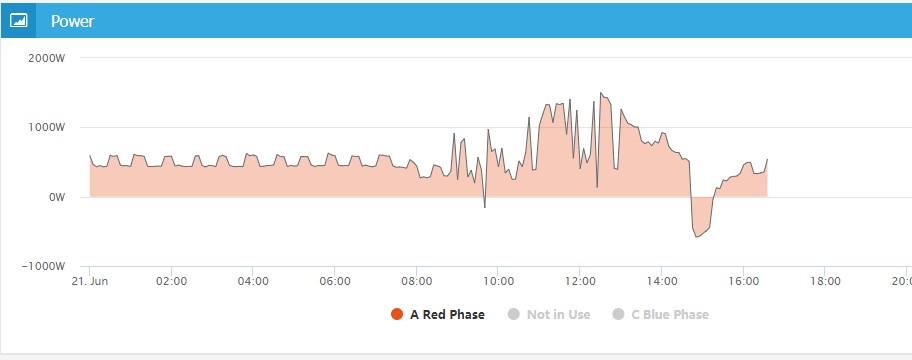
and the this one below is the Blue Phase (C)

The resultant for import and export should be a lot less i would have thought.
Is there any way of getting a clearer import export log..
Cheers
Colin

Hi Colin:
You can view the daily khw value from the bar graph as below picture
By the way, if it's convenient, please take note of the issue mentioned in another topic.

Hi Colin, I am doing the project for HWS sane with you did, could you please help show me how to do it or setup the device? Thank you so much.
Hi:
Please let me know your detailed questions, we will help you to solve it.