Hi,
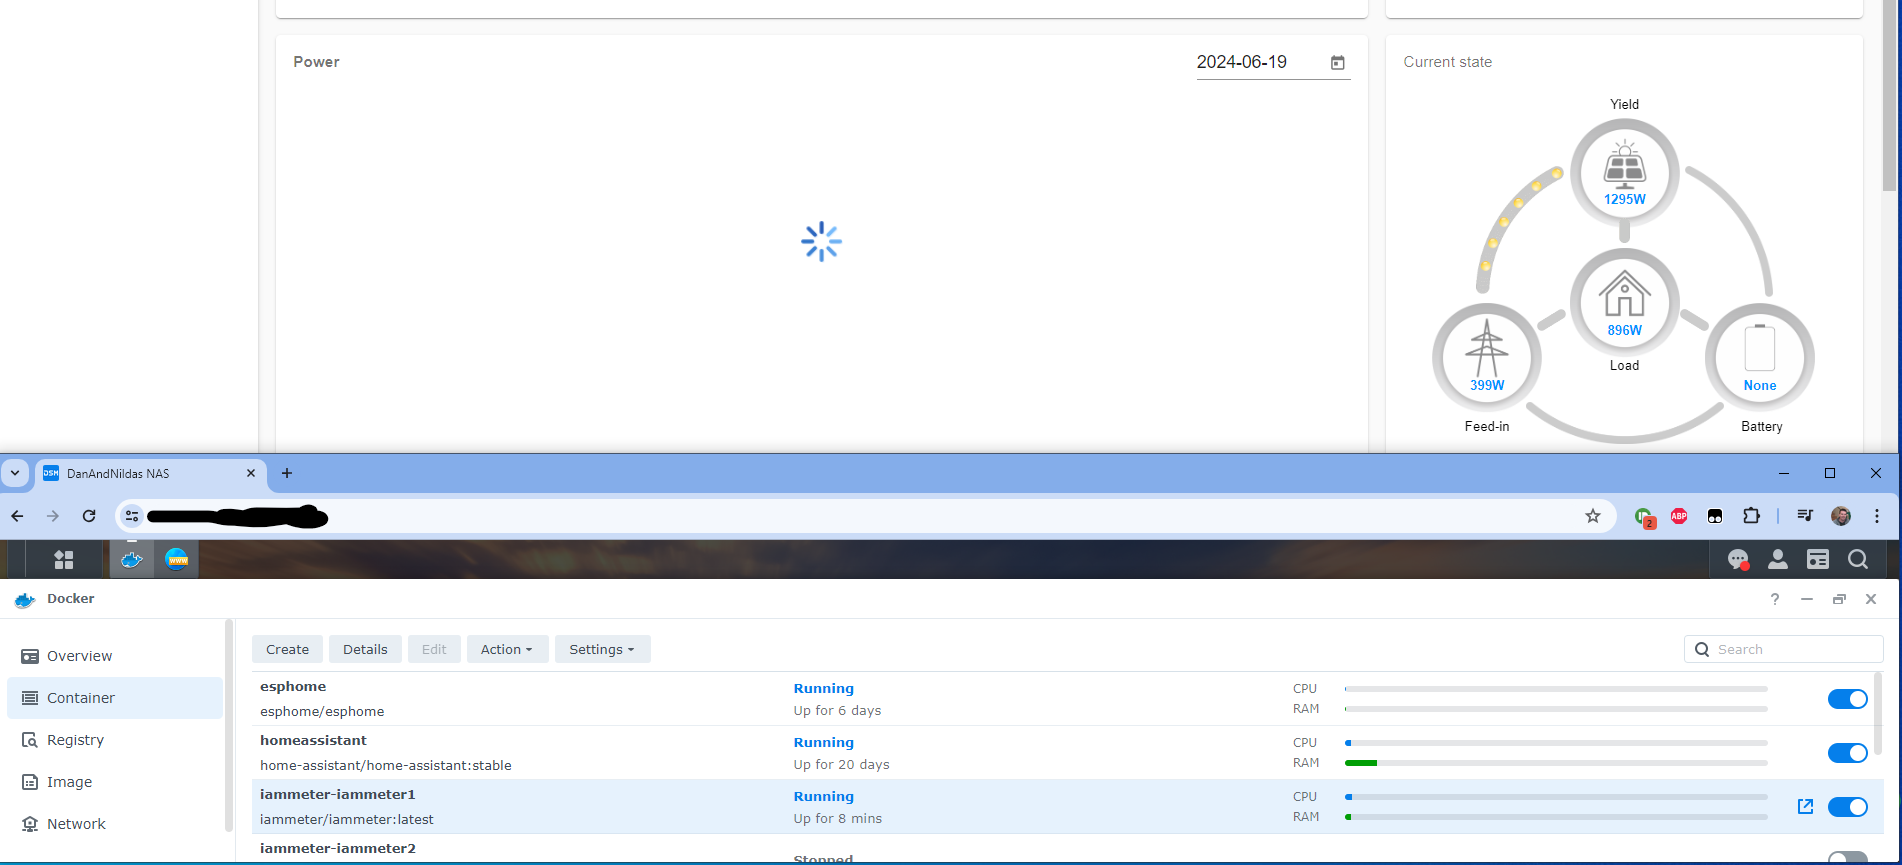
I have a couple of issues that have just started in the past month with my docker deployment, the power graphs have stopped loading, everything else in that portal looks fine, as below. Doesn't appear to be a resource issue as the busiest containers IAMMeter and HomeAssistant are pretty much still idle.
Is there a guide on how to add another meter to upload the data to the docker container, eg my hotwater? When I say add, it has been added but shows no data whatsoever, but the forwarding of that meter to IAMMeter cloud is working fine? as below

In addition as above can the weather be changed here? I have TZ Australia/Brisbane in the env variables in docker but has made no difference.
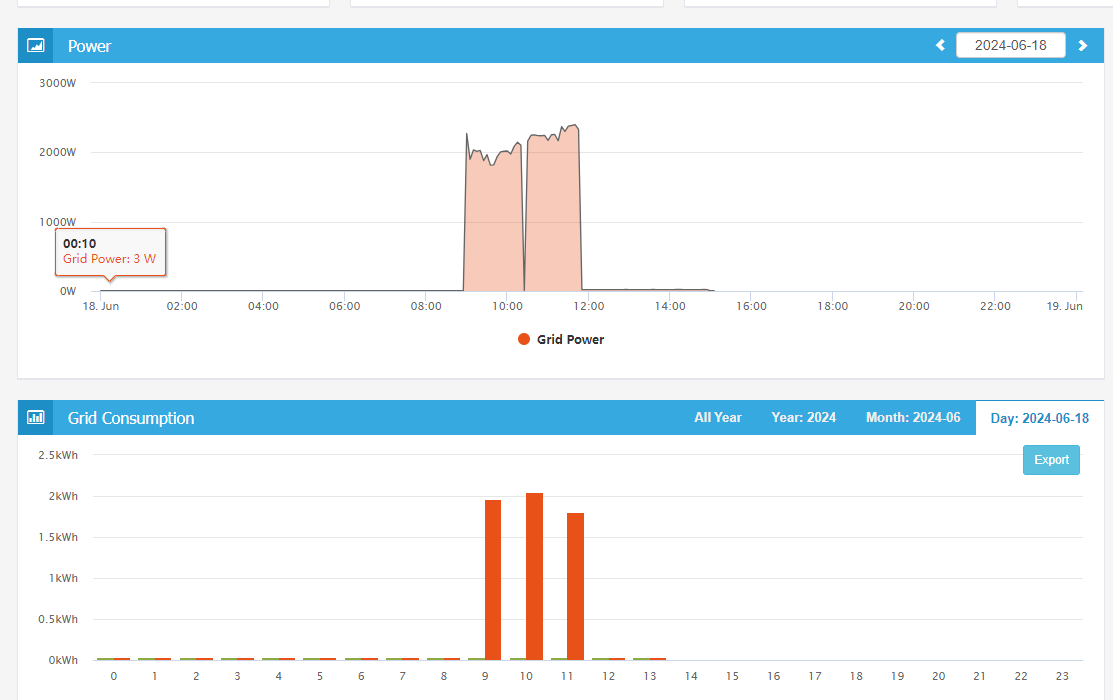
Here are the result from IAMMeter cloud, as you can see there is data.

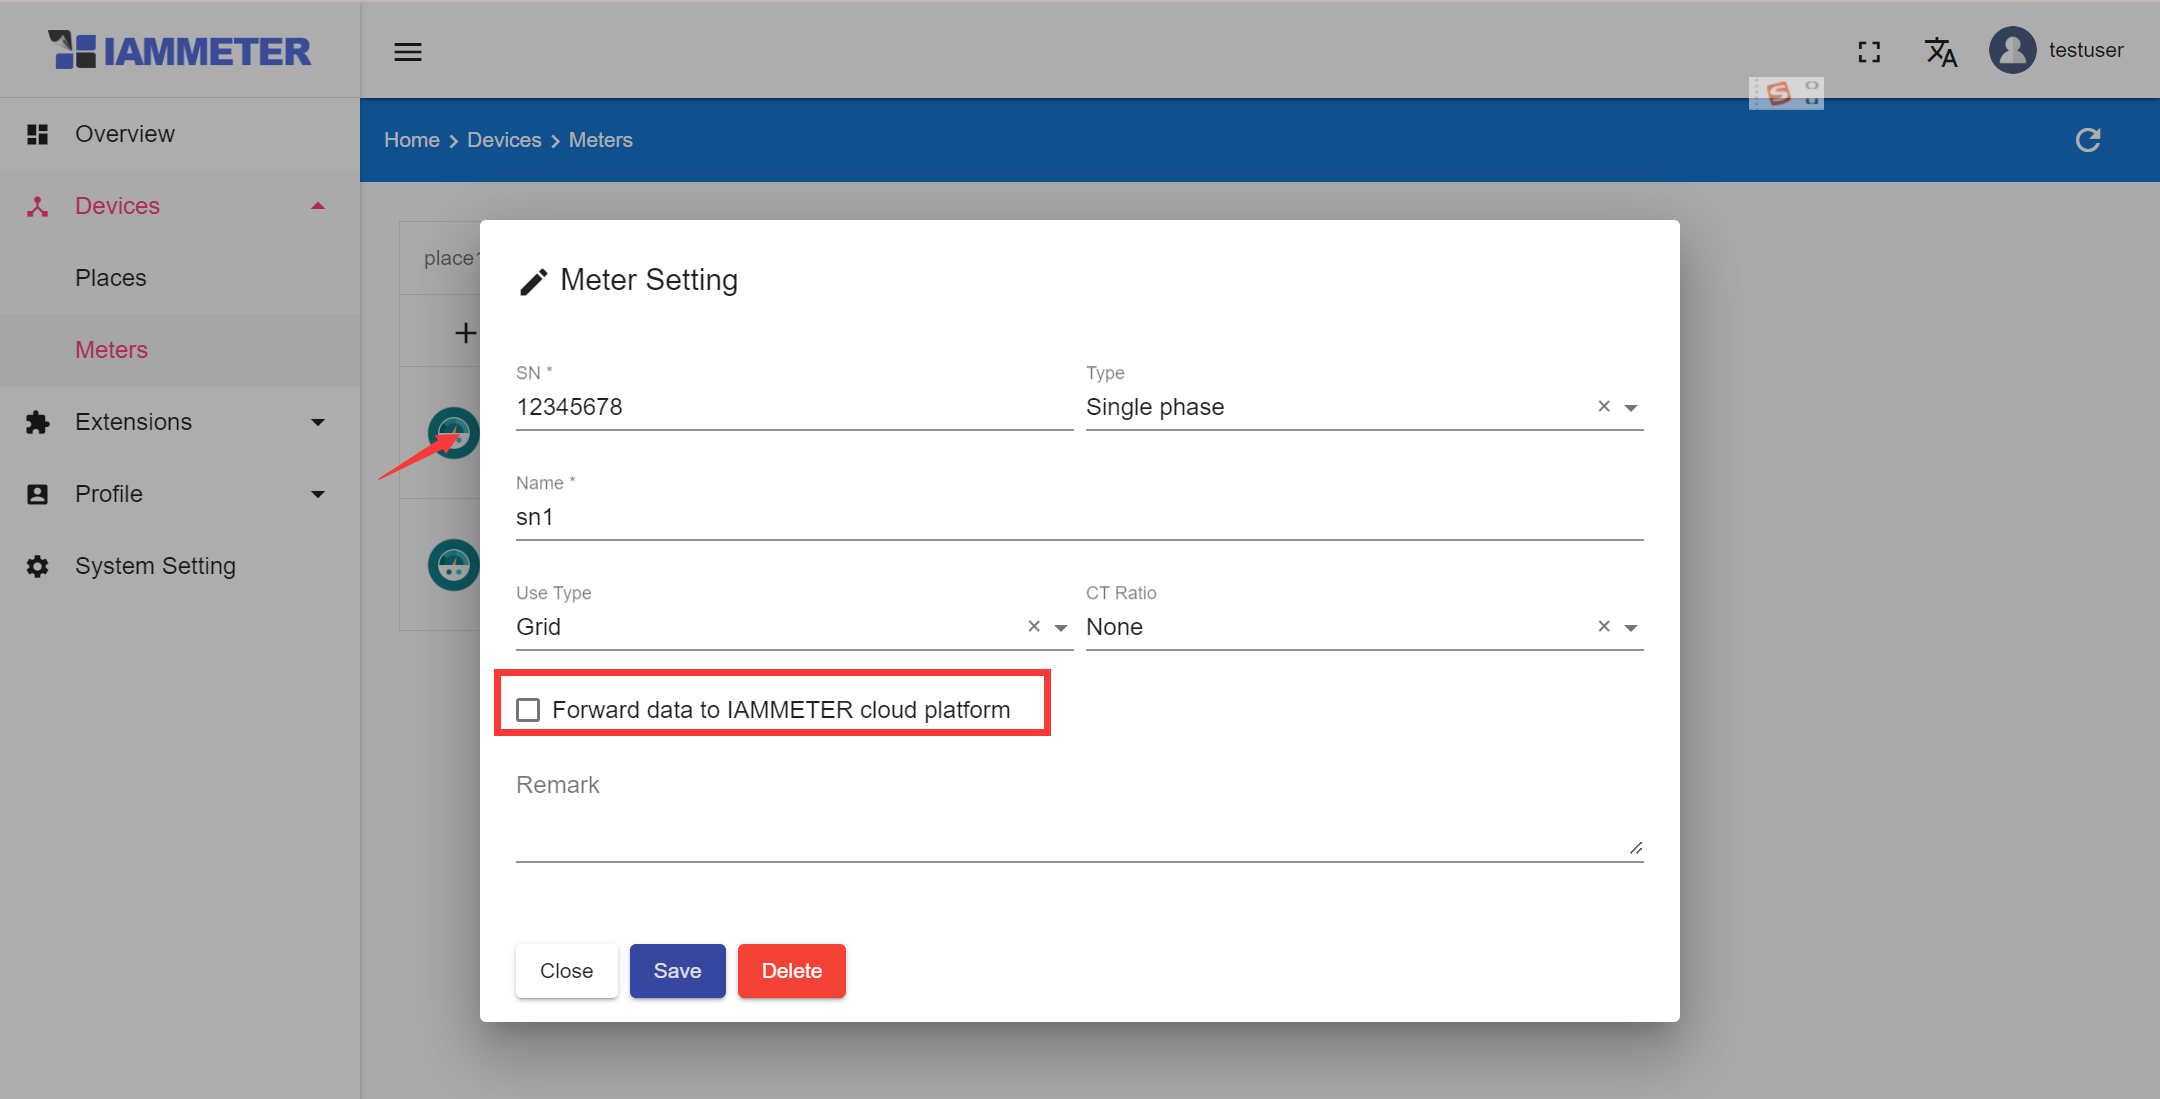
It seems the issue might be due to the "load" setting in the "use type." Please change it to "grid" and check if the data appears.
Hi:
Do you mean,
1 you configure the 1phase meter(used to monitor the heater) to the docker, yes?
please run this API and give me the resulting snapshot.(hide the SN in the snapshot)
2 the docker can not refreshed successfully, but the data is forwarded to the IAMMETER cloud, yes?
If so
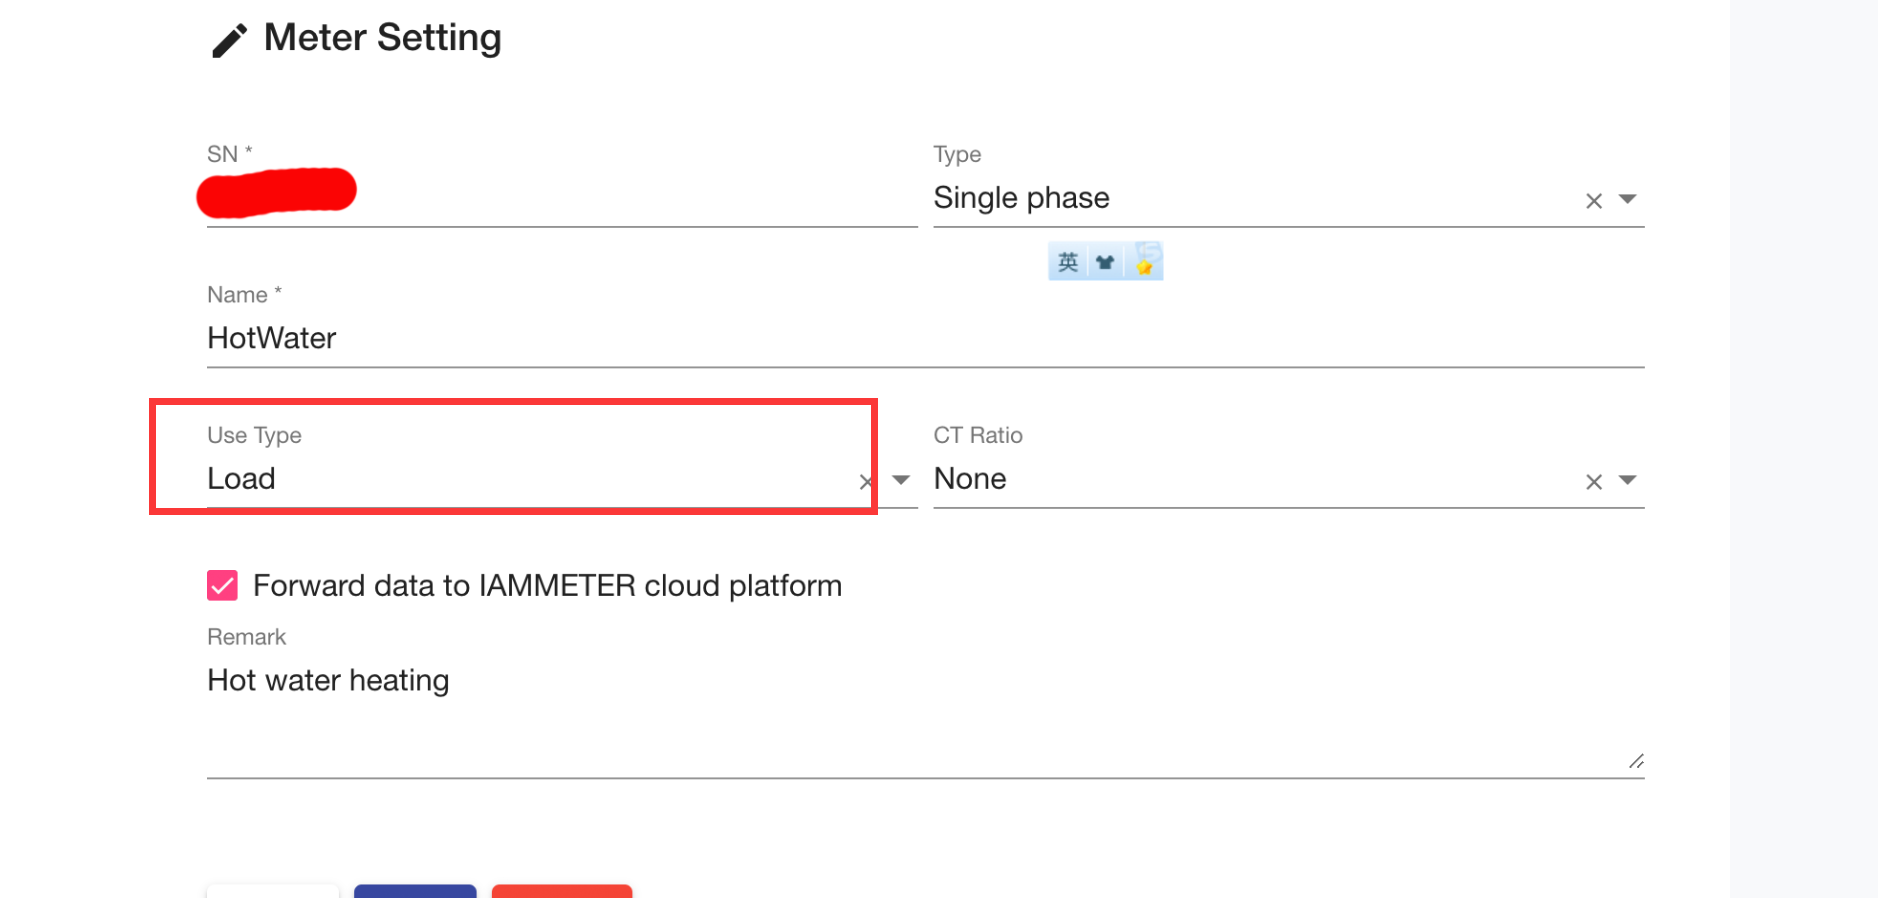
Pleas give me the snapshot of this page, please hide the real sn in the snapshot. Please check whether the load meter (for heater) is exist in this page

and click it to check whether the option of "forward data to IAMMETER-cloud" is enabled
For the question that the docker can not refreshed correctly
Please select the MySQL database instead of SQLite, as SQLite may become unstable with large amounts of data.
https://www.iammeter.com/docs/docker-advanced#mysql
"version": "i.75.99",
"SN": "",
"mac": "",
"type": "PM",
"ssid": "DanAndNildaIoT",
"ip": "192.168.10.6",
"netmask": "255.255.255.0",
"gw": "192.168.10.1",
"dns": "45.90.28.254",
"dhcp": 1,
"runMode": "http",
"uploadAddress": "192.168.1.253:5050/api/v1/sensor/uploadsensor",
"netmeter": 0,
"uploadinterval": 60
}
The uploadAddress are the details of the docker container.
2. Yes cloud fine, not in docker local iammeter pages.
Local IamMeter devices page

Forwarding page

Hi, yes thanks. switching this to grid is now showing in IAM Meter local graphs, but still unsure why my previous existing three phase meter is not showing the graphs
Hi:
Because in IAMMETER-Docker, the use-type of "load" is not handled independently.
If you only add one meter and select the use-type of "load", the IAMMETER-docker will not display it on the chart, only record it in the database.
By the way,I note this post in another thread.

It seems you use a new "place" for the WEM3080 to monitor the energy consumption of the heater, yes?
I still strongly recommend using phase B of the WEM3080T to monitor the heater power. This approach is meaningful since the heater acts as a "special load" in your system, and placing it alongside grid power and inverter power simplifies the analysis. If you add the WEM3080T in a separate "place", it becomes challenging to analyze the relationship between heater power, grid power, and inverter output.
I understand that you have tried using phase B to monitor heater power but had to switch it back to the total load power because it is used in other integrations (for the total load power data).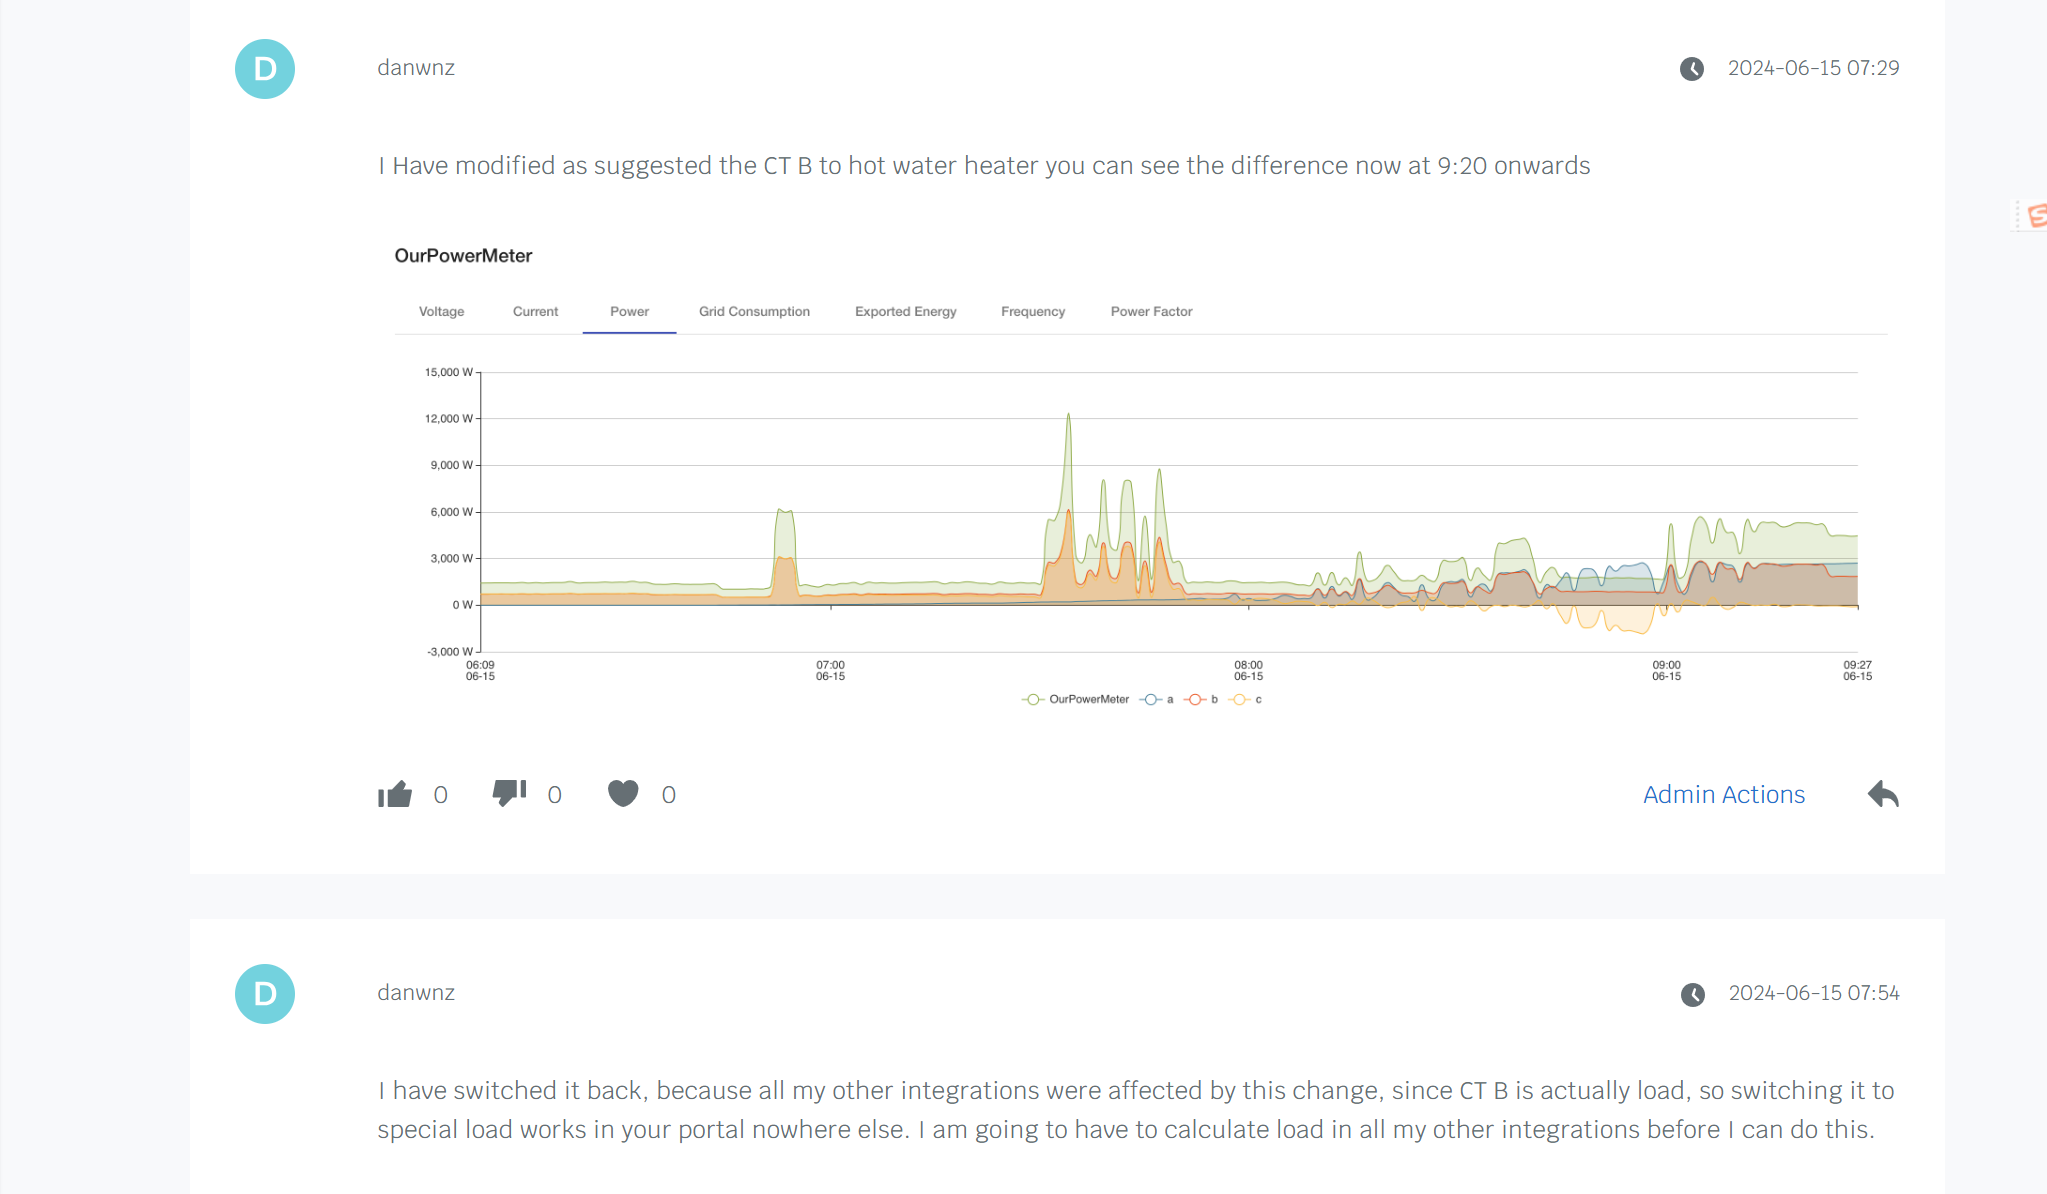
However, I recommend the following:
Use Phase B Exclusively for Monitoring Heater Power: This will give you accurate and isolated data for the heater.
Replace Phase B in Other Integrations with the Sum of "Inverter Power" and "Grid Power"(inverter power + grid power).
This calculation formula for the total load power, which is also displayed as the "load" curve in the power chart. you will find it very closely matches the "special load" power curve(measured by phase B directly).
Yes I agree about using CT B for special load would be great. The problem is I need to get my head around the calculations for this uploading to PVOutput and the many modifications I would need to make in Home Assistant blueprints, scripts and automations.
Your system works the opposite to most of these, where you use generation and grid figures, and calculate the load and special load.
PVOutput for instance uses the generation and load figures and uses this to calculate the grid feed in (export), which is why I believe the PVOutput integration does not work properly due to negative figures, previously reported. I use CT B and CT A and blueprints, scripts and automations, 5 minute mean power consumption calculations in Home Assistant to upload.
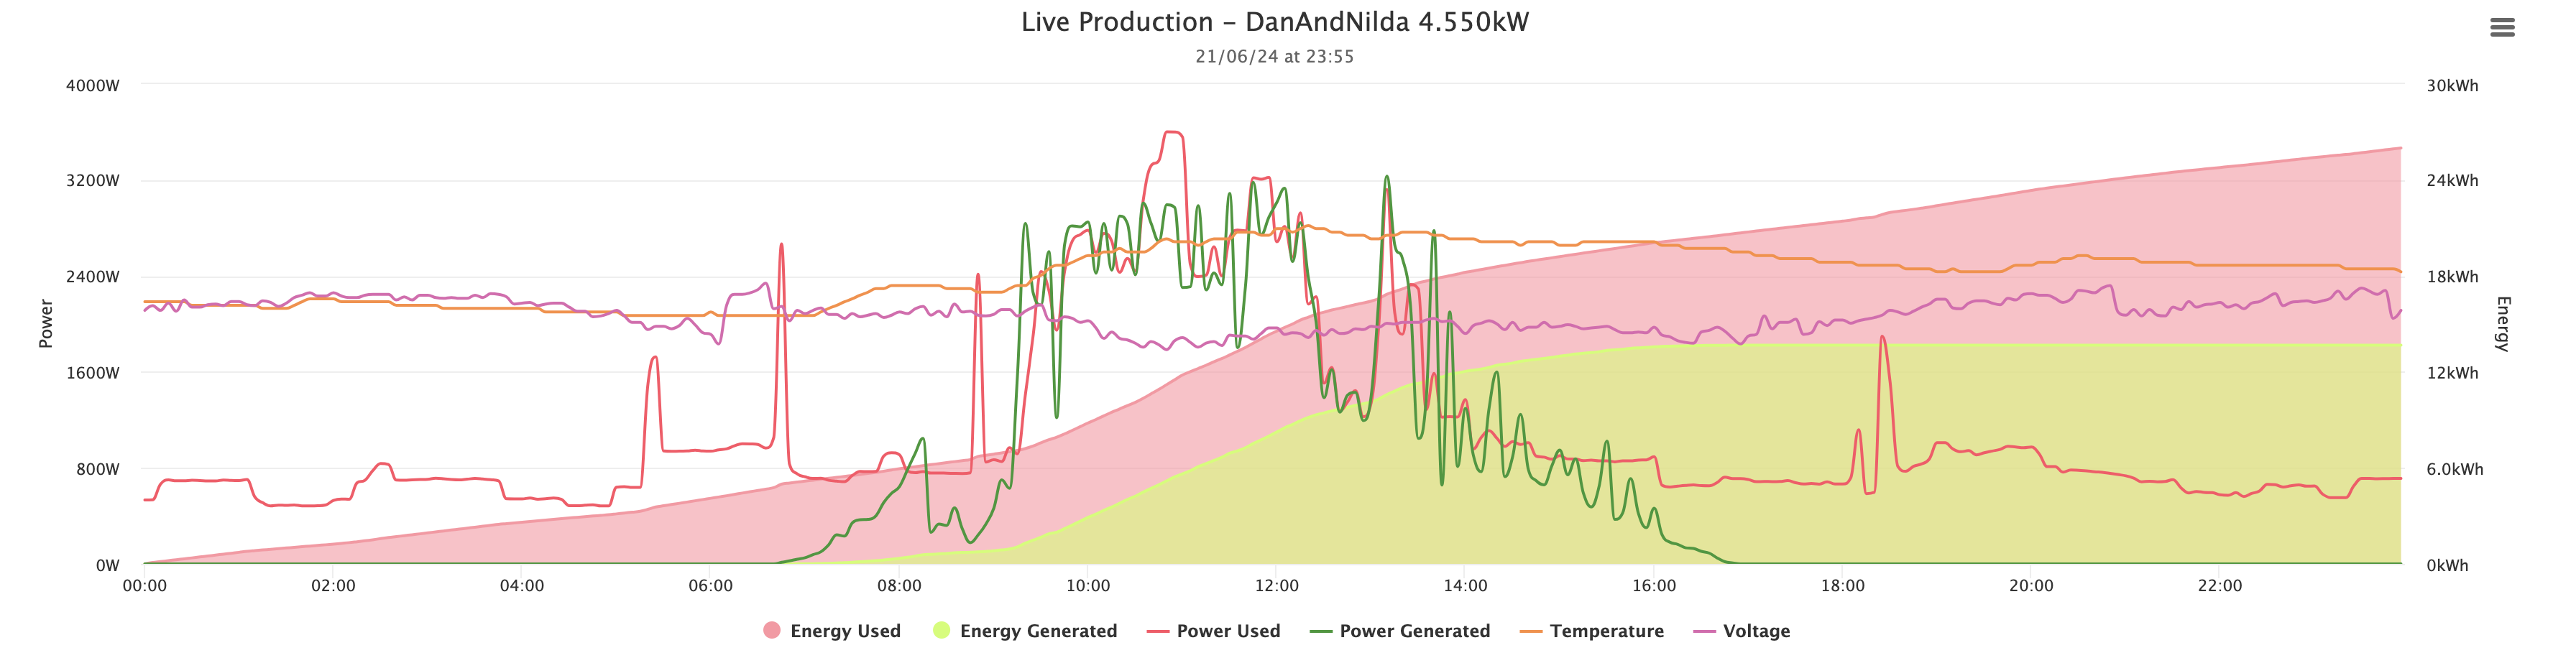
The mean power calcs were added due to more often than not my jug heating and many other short lived power consumption uses missing, see example today in the charts missing jug boiling at about 6am.

now vs PVOutput at 6am you will see the jug boil.

I found a number of issues with the docker image and uploading to pvoutput when I tried it on my Synology NAS a couple of years ago. The issue I had was malformed data.
My recommendation is to use Modbus-TCP to send meter data to Home Assistant, let the meters send data direct to IAMMETER-cloud and use Home Assistant to update pvoutput via a rest_command.
This is the payload I use but yours might be a bit different
payload: 'd={{as_local(now()).strftime("%Y%m%d&t=%H:%M")}}&v1={{states.sensor.yield_energy_wh.state|float(0)|round(0)}}&v2={{states.sensor.modbus_power_c.state|float(0)}}&v3={{states.sensor.grid_consumption_energy_wh.state|float(0)|round(0)}}&v4={{states.sensor.load_power.state|float(0)|round(0)}}&v6={{states.sensor.modbus_voltage_a.state|float(0)}}&c1=1'
This configuration has proved to be bulletproof for a couple of years now despite just using a Rasperry pi for HA.
Exactly what I did, because of negative values constantly, PVOutput will 100% not accept them so no data more than data. I did report it and they made changes to the PVOutput integration, but it didn't help. I was advised that they hadn't put much effort in it because there was little to no interest, I can guarantee that is because it did not work, exactly what I was advised in the home assistant forums, I do like this method much better after setting it all up because I can also upload my other data from Home Assistant, weather station data, and hot water separately monitored now. I did have other extended values here but that system tplink power monitoring for fish tanks, pool chlorinator and Victron battery charger, tplink data was too unreliable so at times was causing upload issues.