Tutorial : set the TOU(time of use) bill mode in the Home Assistant
Abstract: use one energy meter (brand IAMMETER) to show how to set the TOU(Time Of Use) billing mode in the Home assistant.
Video tutorial:https://youtu.be/7uTE4NAqF_E
Please note: this is a universal tutorial about setting the time of use billing template in the Home Assistant. It does not ask to use a specific brand of energy meter.
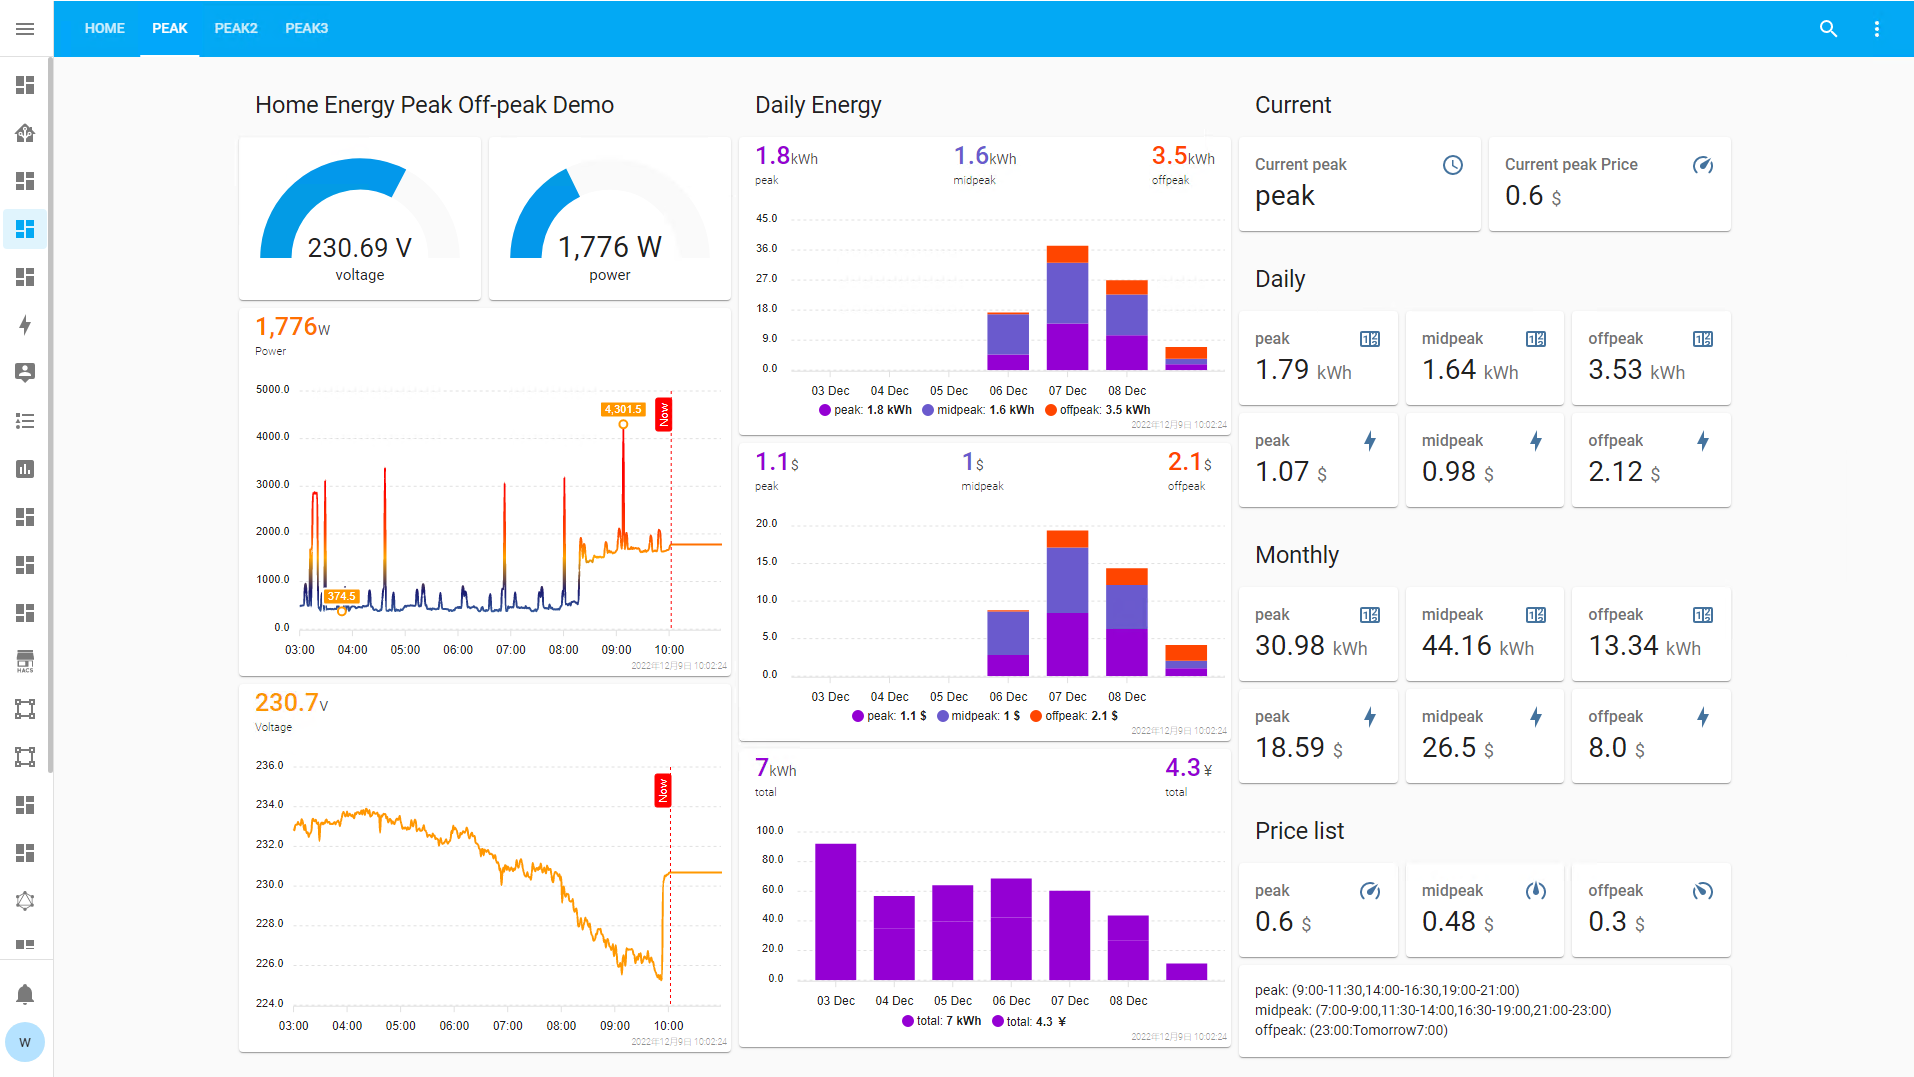
This is the effect of display the TOU(time of use) billing information in the dashboard.
Integrate Energy meter
In this chapter, we use IAMMETER`s energy meter as the example hardware. This tutorial is not related to a specific brand, you can use your own energy meter in your hand.
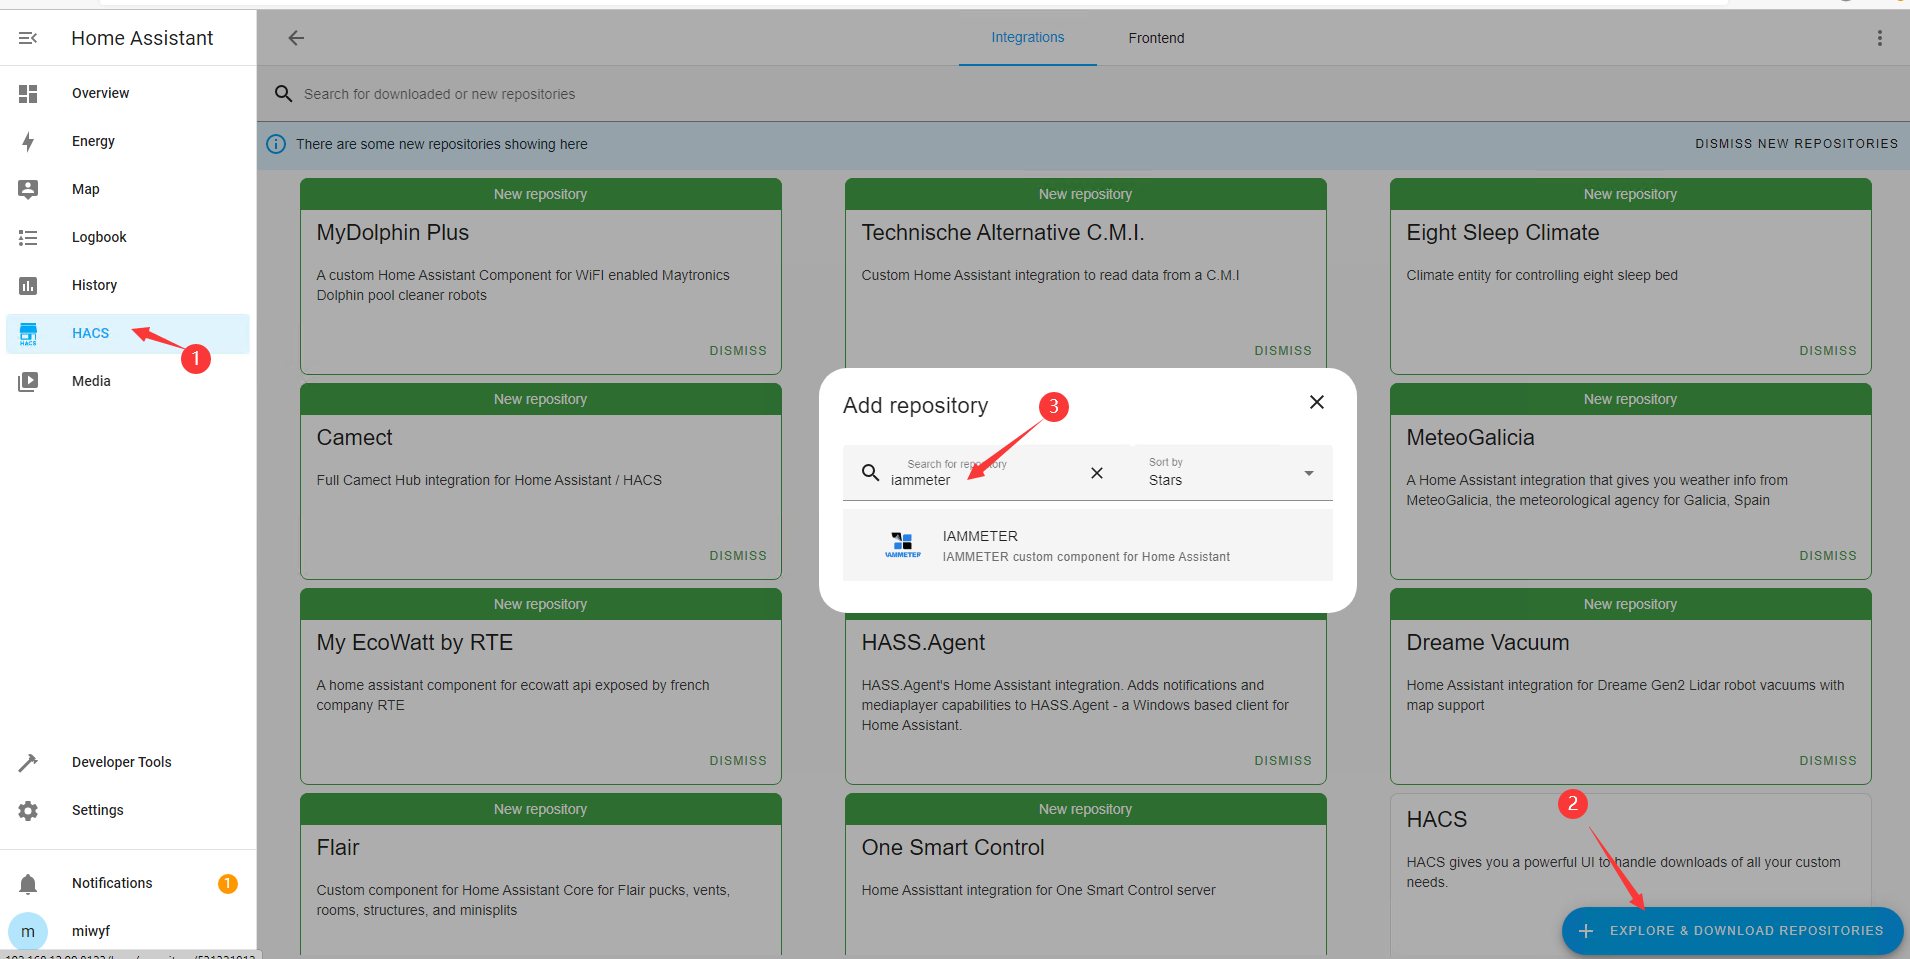
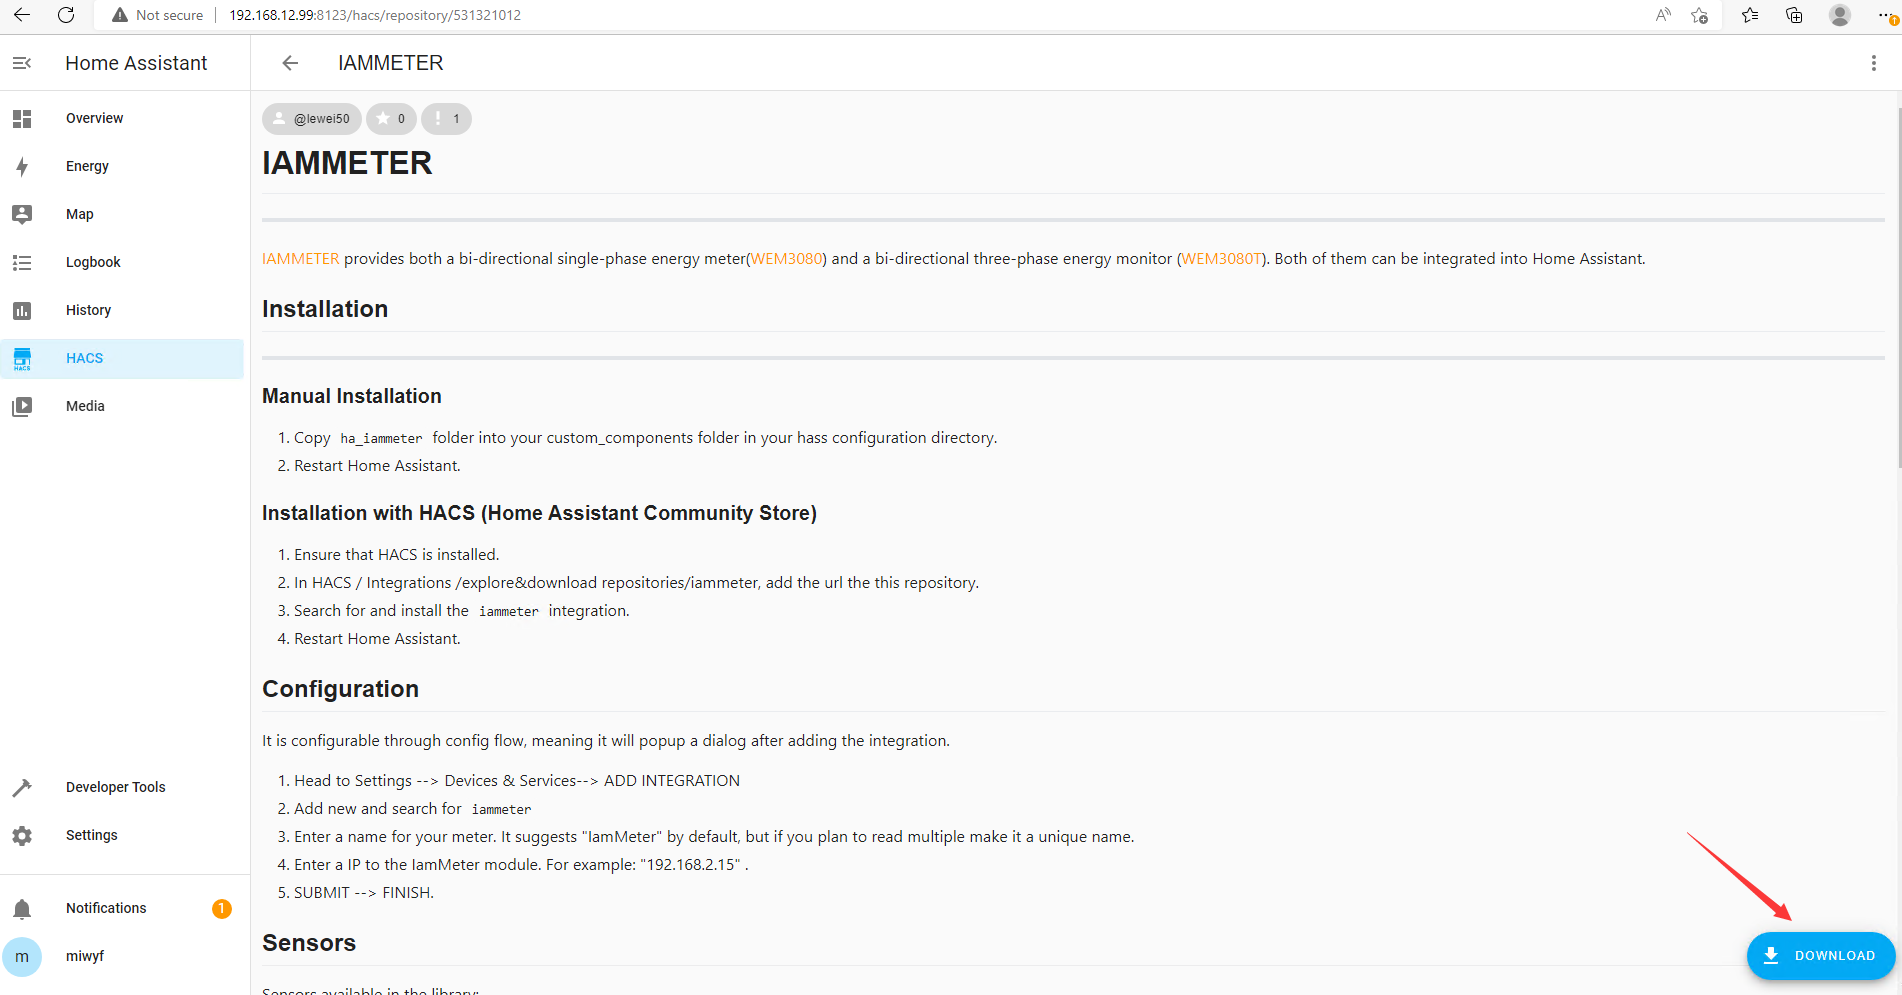
Add the repository of IAMMETER from the HACS
Click HACS, search "IAMMETER".
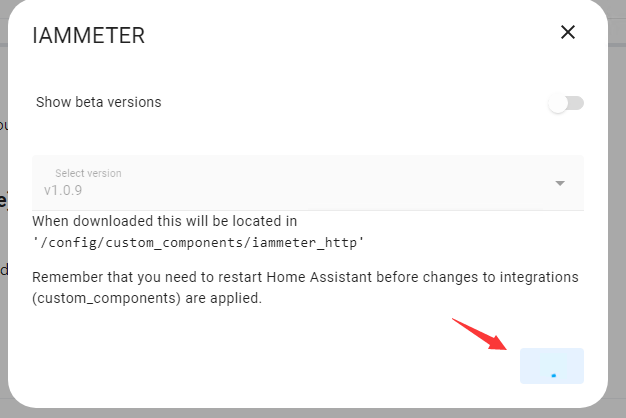
Add Energy meter
Setting->"Device & Service"
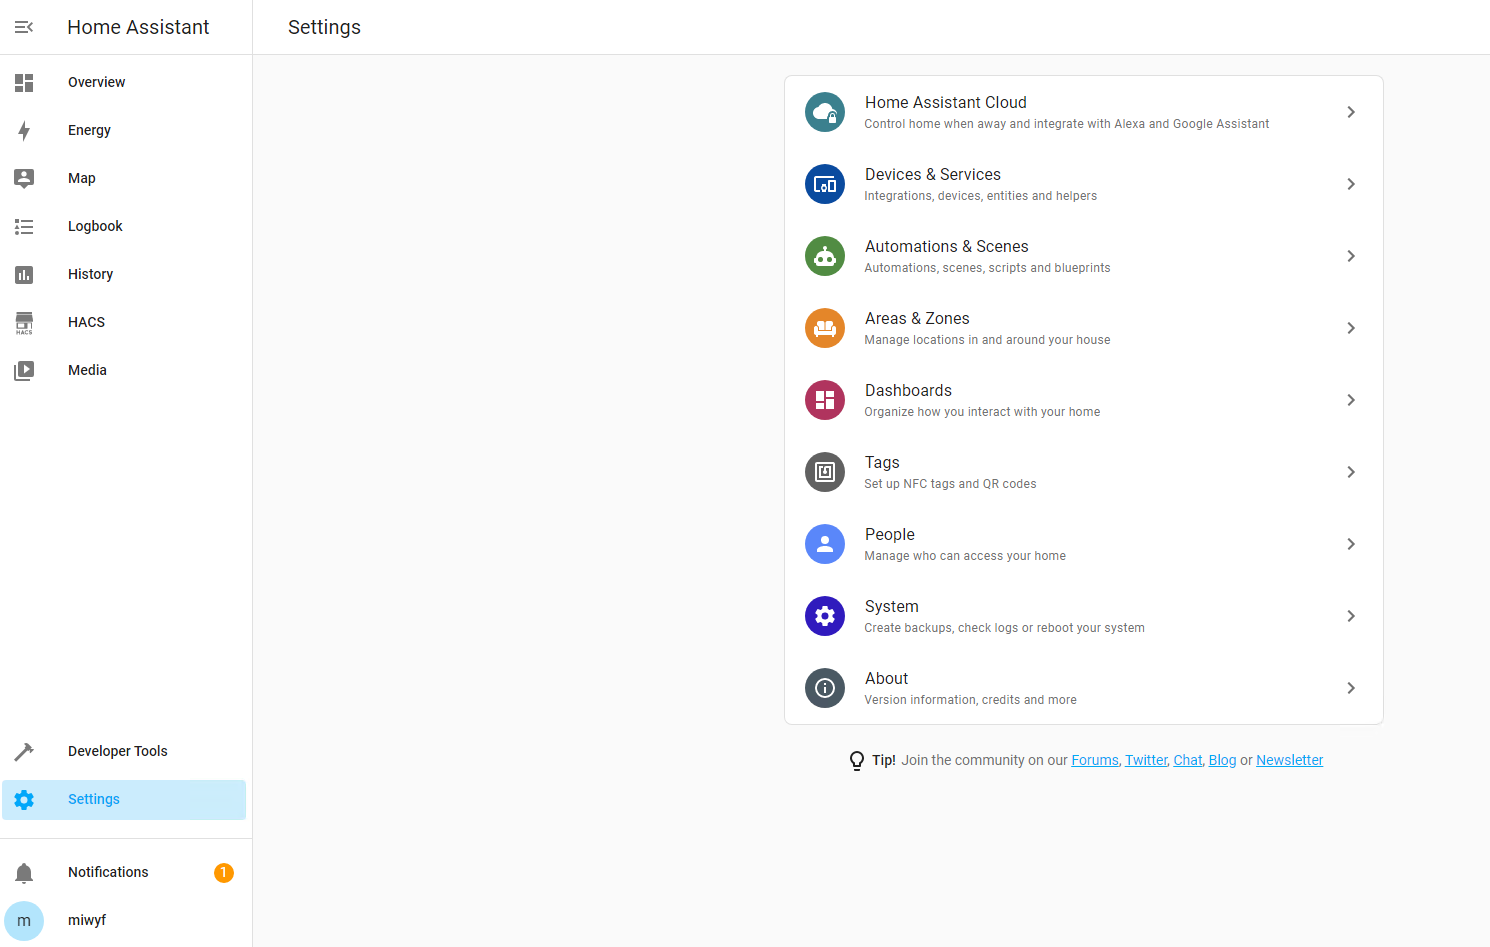
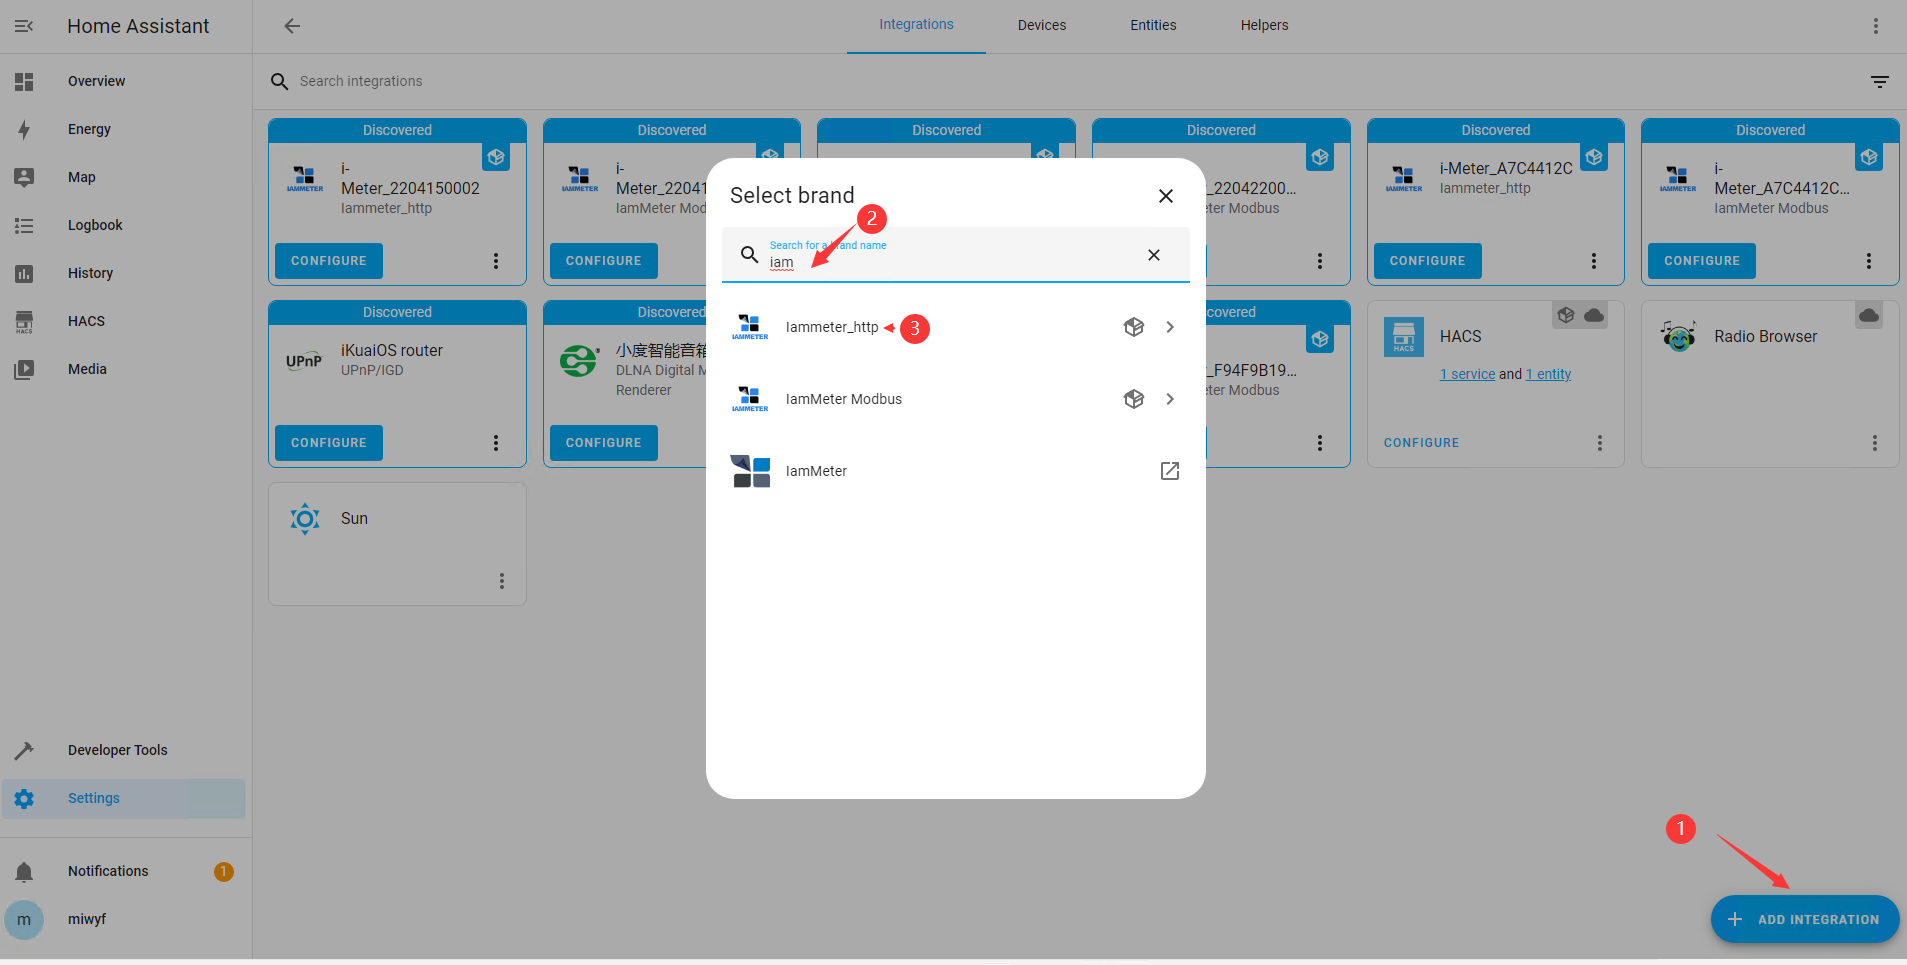
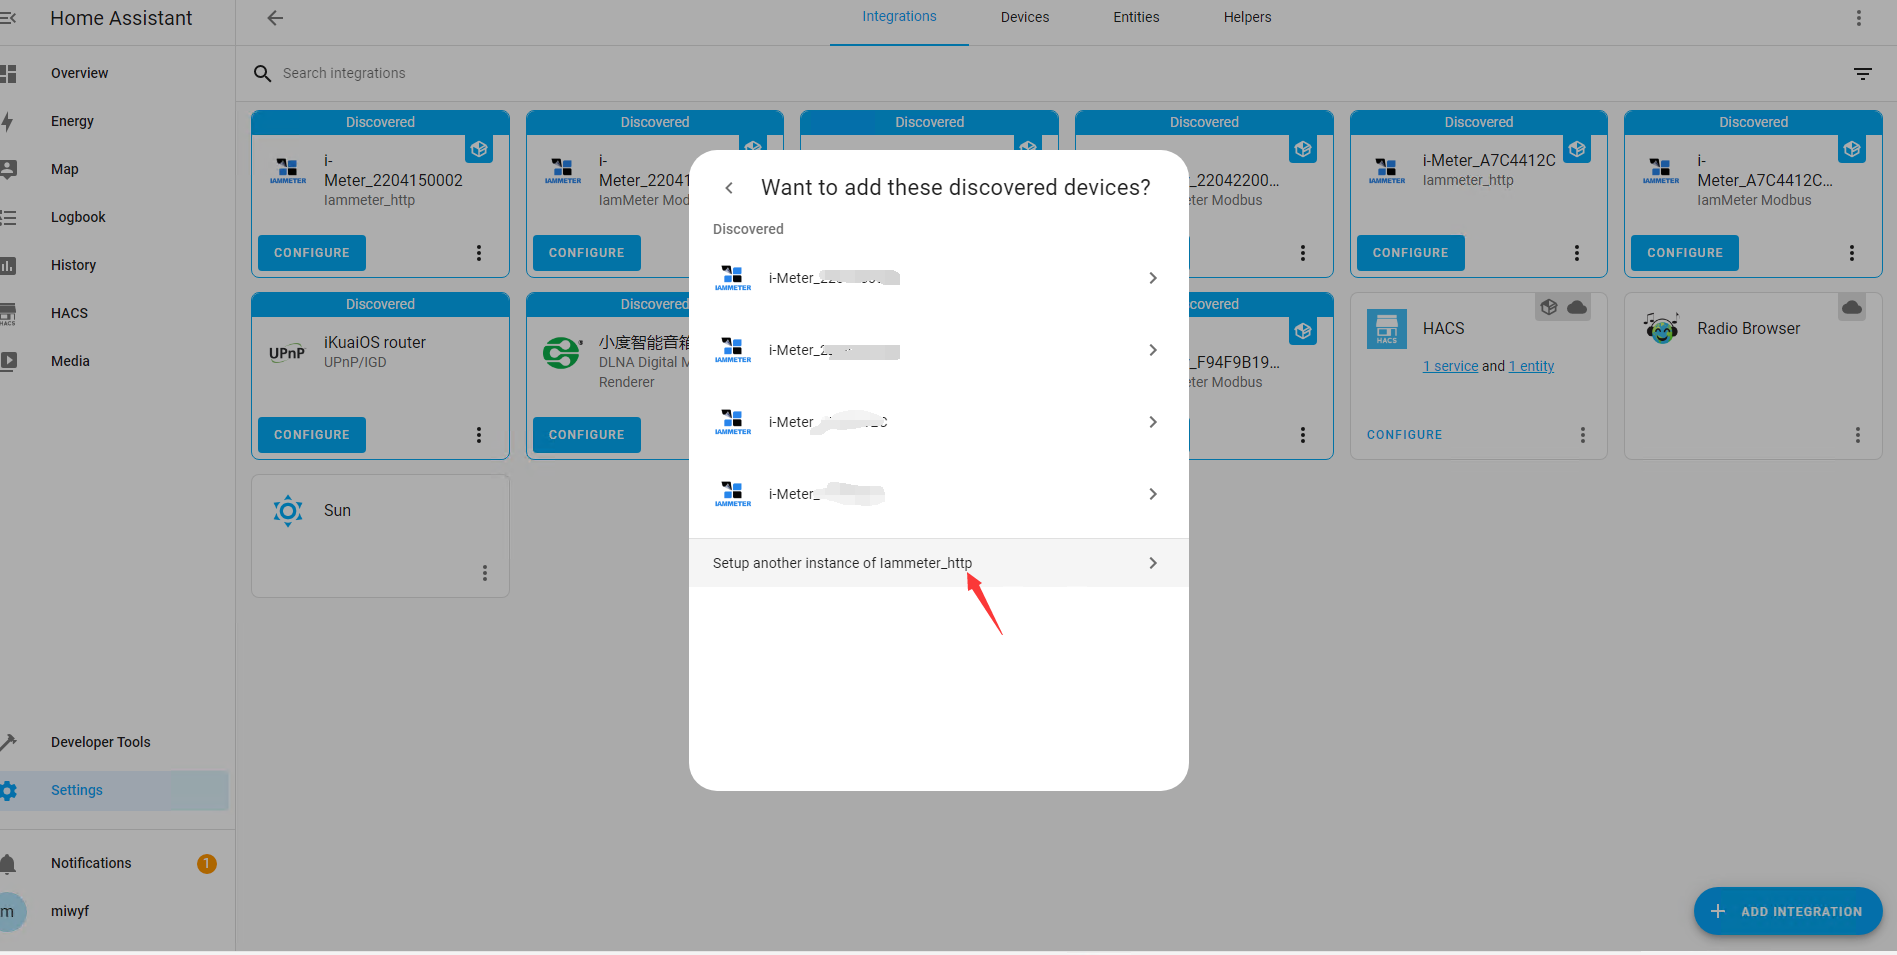
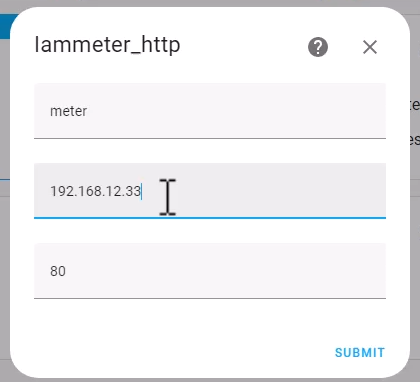
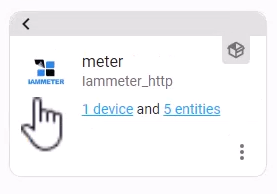
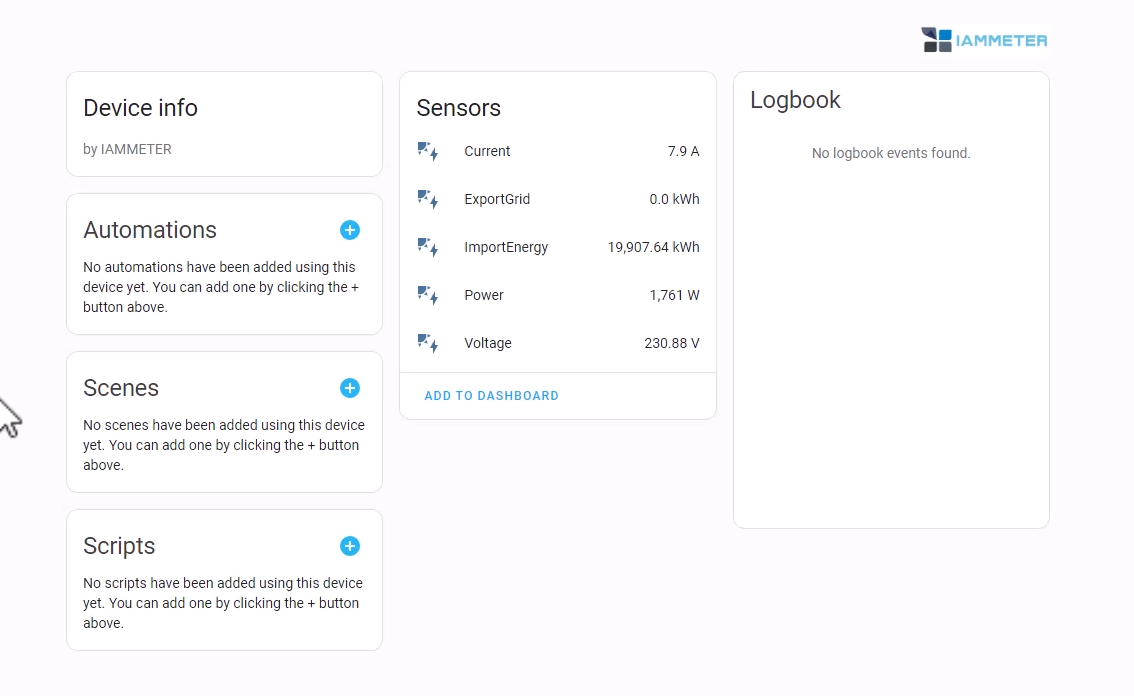
Add the TOU (Time of Use) billing template from a Yaml file.
click "File editor"
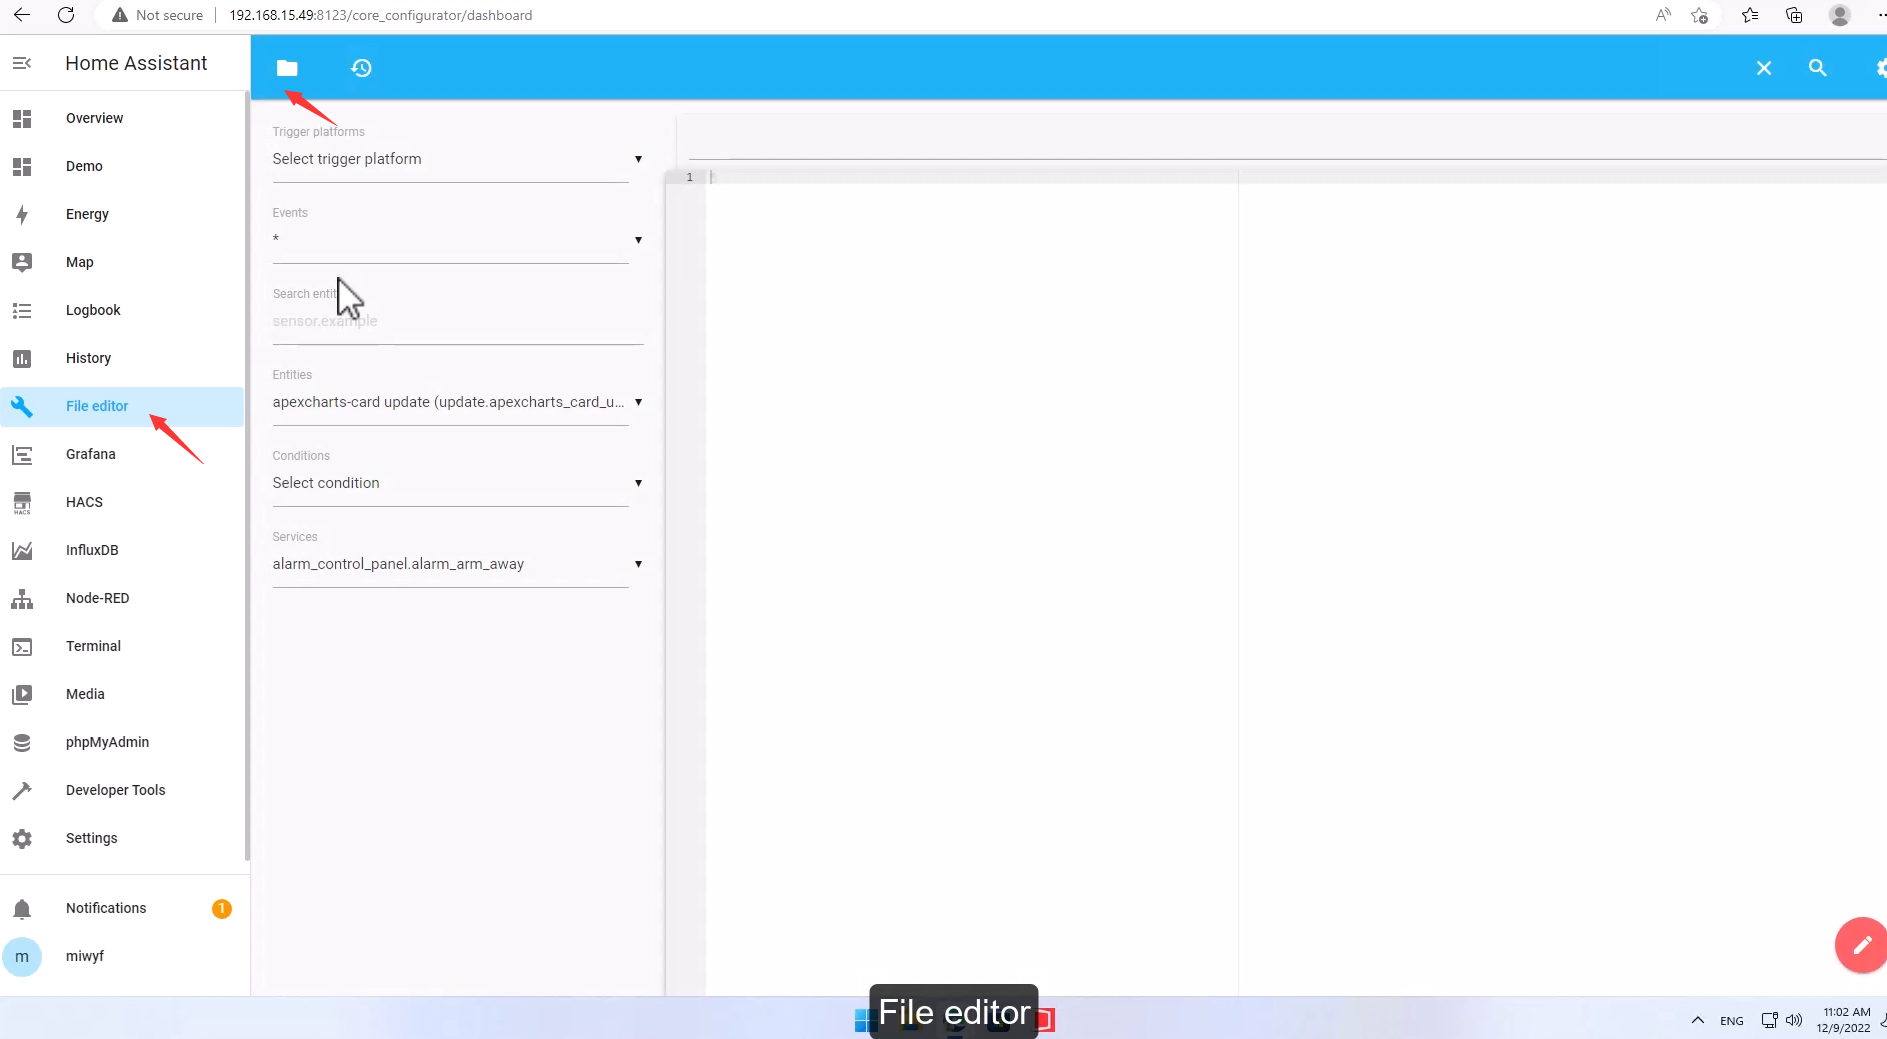
add a new YAML, named "peak.yaml"
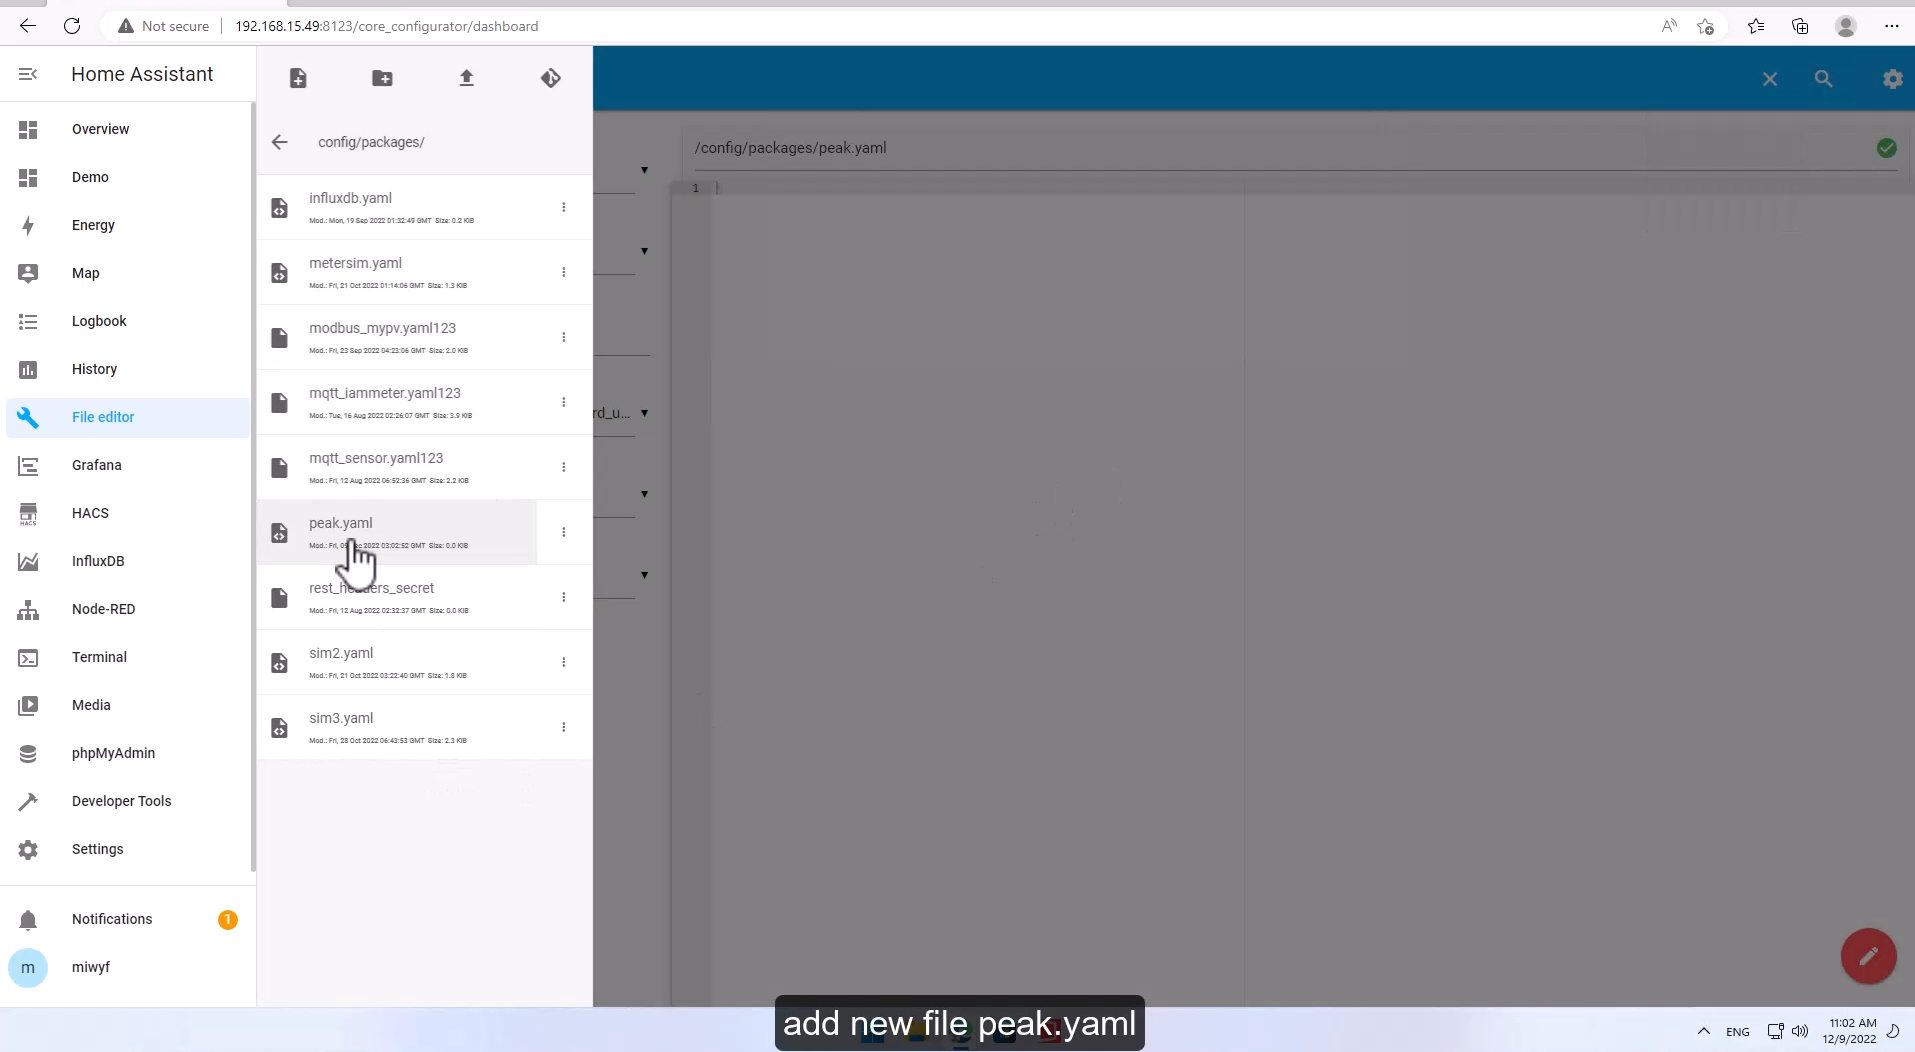
Add the following configuration in "peak.yaml"
You can also download the "peak.yaml" from the github here
# Example configuration entrysensor:- platform: templatesensors:#----peak----### https://community.home-assistant.io/t/scraping-alectra-utilities-power-website/304234energy_price_offpeak:friendly_name: "Off-peak Price"value_template: "0.3"icon_template: mdi:speedometer-slowunit_of_measurement: "$"energy_price_midpeak:friendly_name: "Mid-peak Price"value_template: "0.48"icon_template: mdi:speedometer-mediumunit_of_measurement: '$'energy_price_onpeak:friendly_name: "On-peak Price"value_template: "0.6"icon_template: mdi:speedometerunit_of_measurement: '$'# Looks at scraped string and finds the three values that are "0.###" and picks the right one for the current peak. This block is under platform: templateenergy_price_current:friendly_name: "Current peak Price"value_template: >-{% if is_state('select.daily_energy', 'offpeak') %}{{(states('sensor.energy_price_offpeak'))}}{% elif is_state('select.daily_energy', 'midpeak') %}{{(states('sensor.energy_price_midpeak'))}}{% elif is_state('select.daily_energy', 'peak') %}{{(states('sensor.energy_price_onpeak'))}}{% else %}0{% endif %}icon_template: >-{% if is_state('select.daily_energy', 'offpeak') %}mdi:speedometer-slow{% elif is_state('select.daily_energy', 'midpeak') %}mdi:speedometer-medium{% elif is_state('select.daily_energy', 'peak') %}mdi:speedometer{% else %}mdi:exclamation-thick{% endif %}unit_of_measurement: '$'daily_energy_peak_money:unit_of_measurement: '$'value_template: "{{ ( states('sensor.daily_energy_peak')|float * states('sensor.energy_price_current')|float ) | round(2) }}"daily_energy_midpeak_money:unit_of_measurement: '$'value_template: "{{ ( states('sensor.daily_energy_midpeak')|float * states('sensor.energy_price_current')|float ) | round(2) }}"daily_energy_offpeak_money:unit_of_measurement: '$'value_template: "{{ ( states('sensor.daily_energy_offpeak')|float * states('sensor.energy_price_current')|float ) | round(2) }}"monthly_energy_peak_money:unit_of_measurement: '$'value_template: "{{ ( states('sensor.monthly_energy_peak')|float * states('sensor.energy_price_current')|float ) | round(2) }}"monthly_energy_midpeak_money:unit_of_measurement: '$'value_template: "{{ ( states('sensor.monthly_energy_midpeak')|float * states('sensor.energy_price_current')|float ) | round(2) }}"monthly_energy_offpeak_money:unit_of_measurement: '$'value_template: "{{ ( states('sensor.monthly_energy_offpeak')|float * states('sensor.energy_price_current')|float ) | round(2) }}"meter_energy_daily_money:unit_of_measurement: '$'value_template: "{{ (states('sensor.daily_energy_peak_money')) + (states('sensor.daily_energy_midpeak_money')) + (states('sensor.daily_energy_offpeak_money')) }}"meter_energy_monthly_money:unit_of_measurement: '$'value_template: "{{ (states('sensor.monthly_energy_peak_money')) + (states('sensor.monthly_energy_midpeak_money')) + (states('sensor.monthly_energy_offpeak_money')) }}"utility_meter:meter_energy_daily:source: sensor.meter_importenergycycle: dailymeter_energy_monthly:source: sensor.meter_importenergycycle: monthlydaily_energy:source: sensor.meter_importenergyname: Daily Energycycle: dailytariffs:- peak- offpeak- midpeakmonthly_energy:source: sensor.meter_importenergyname: Monthly Energycycle: monthlytariffs:- peak- offpeak- midpeak## time:## peak(9:00—11:30、14:00—16:30、19:00—21:00)、## midpeak(7:00—9:00、11:30—14:00、16:30—19:00、21:00—23:00)、## offpeak(23:00—Tomorrow7:00)。automation:trigger:- platform: timeat: "07:00:00"variables:tariff: "midpeak"- platform: timeat: "09:00:00"variables:tariff: "peak"- platform: timeat: "11:30:00"variables:tariff: "midpeak"- platform: timeat: "14:00:00"variables:tariff: "peak"- platform: timeat: "16:30:00"variables:tariff: "midpeak"- platform: timeat: "19:00:00"variables:tariff: "peak"- platform: timeat: "21:00:00"variables:tariff: "midpeak"- platform: timeat: "23:00:00"variables:tariff: "offpeak"# condition:# condition: time# weekday:# - mon# - tue# - wed# - thu# - friaction:- service: select.select_optiontarget:entity_id: select.daily_energydata:option: "{{ tariff }}"- service: select.select_optiontarget:entity_id: select.monthly_energydata:option: "{{ tariff }}"
CHECK CONFIGURATION, RESTART
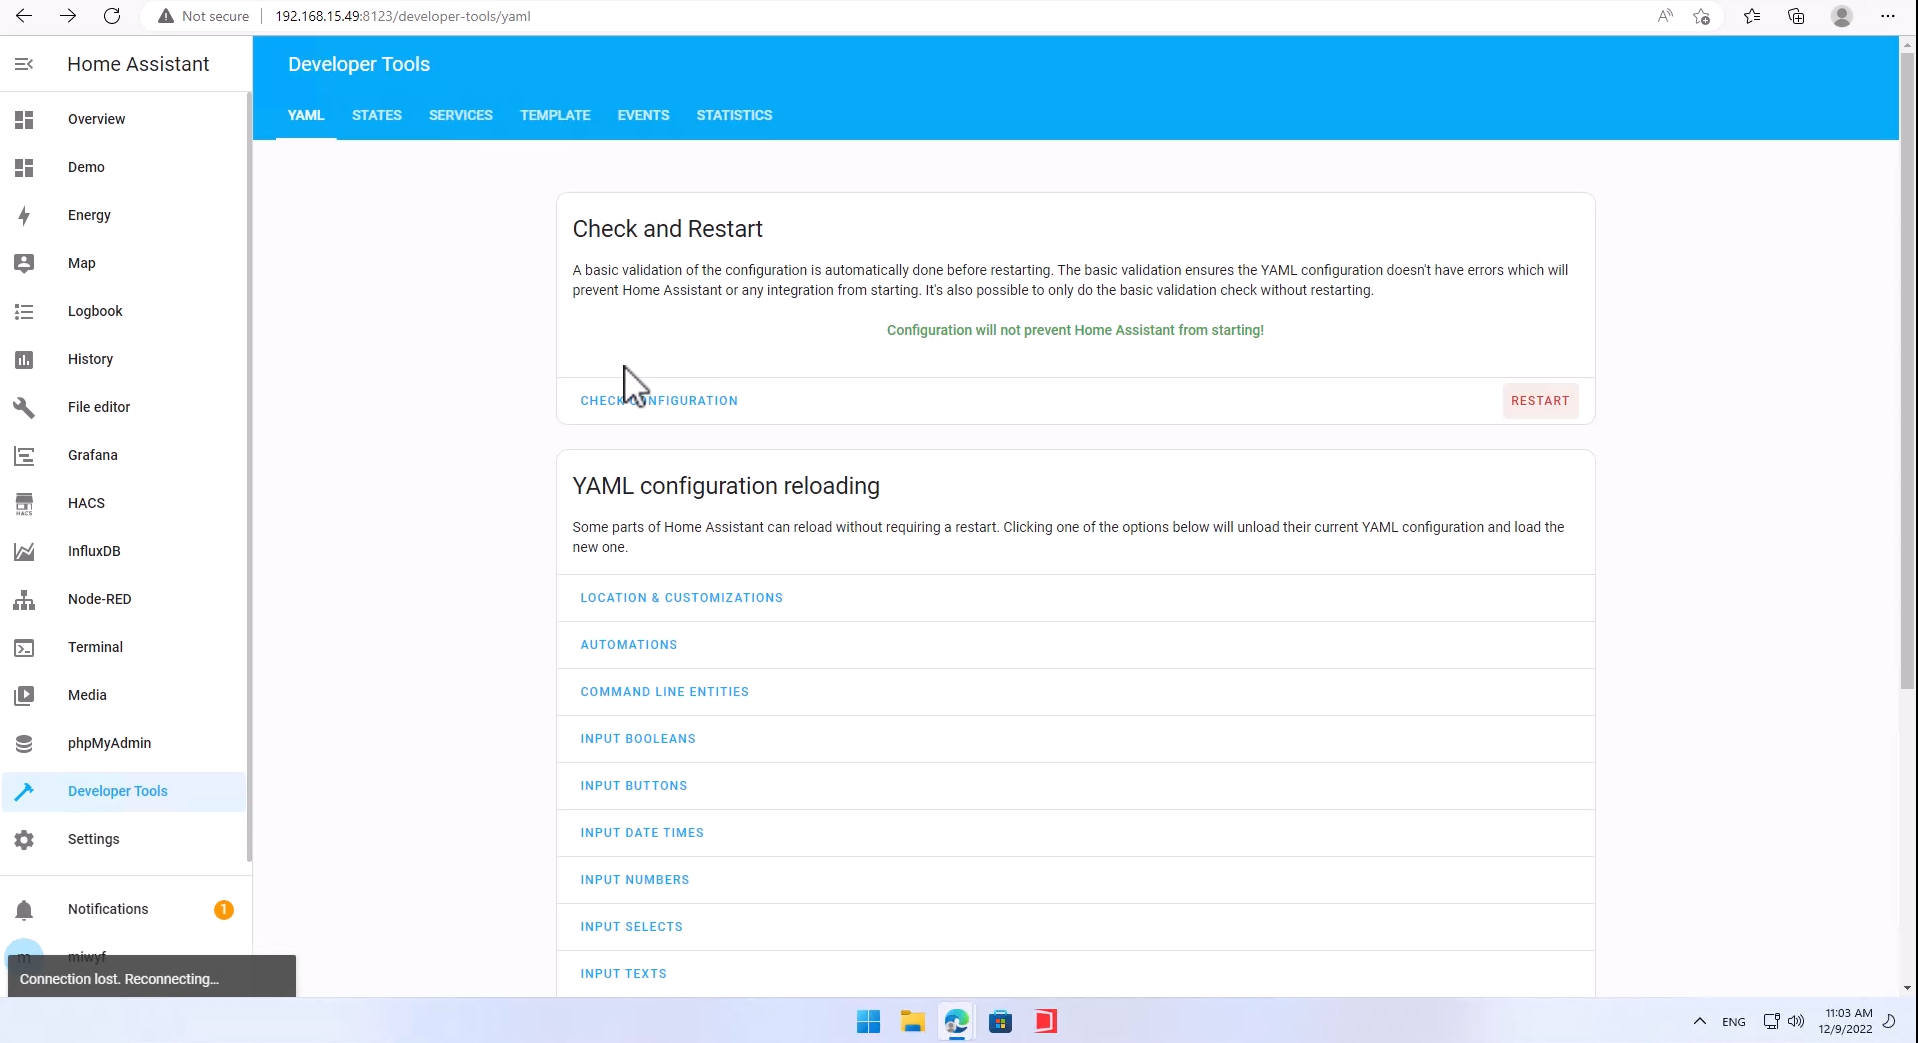
Configure the Dashboard(optional)
This chapter just gives a dashboard example to show the TOU billing effect. It is not a necessary step for the TOU billing, you can also use your own dashboard to display the TOU effect.
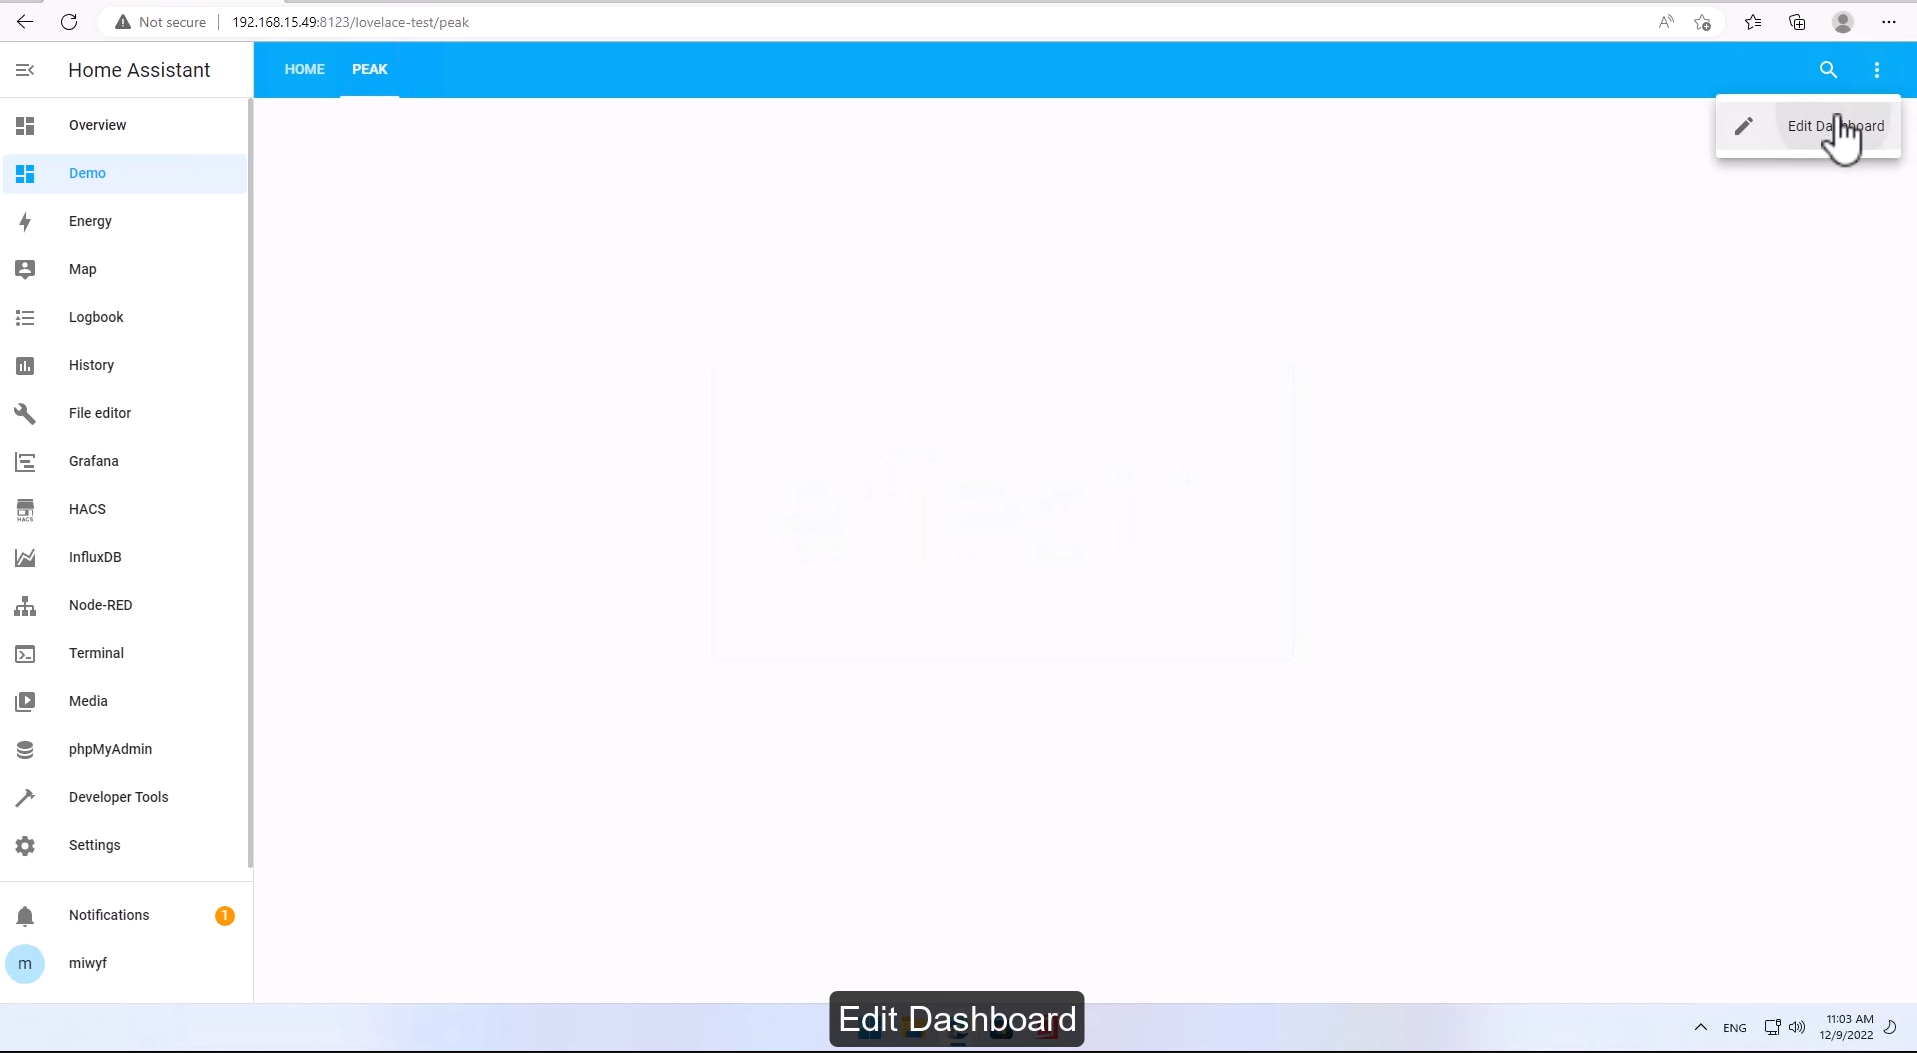
Add the following cards to Lovelace
Card1
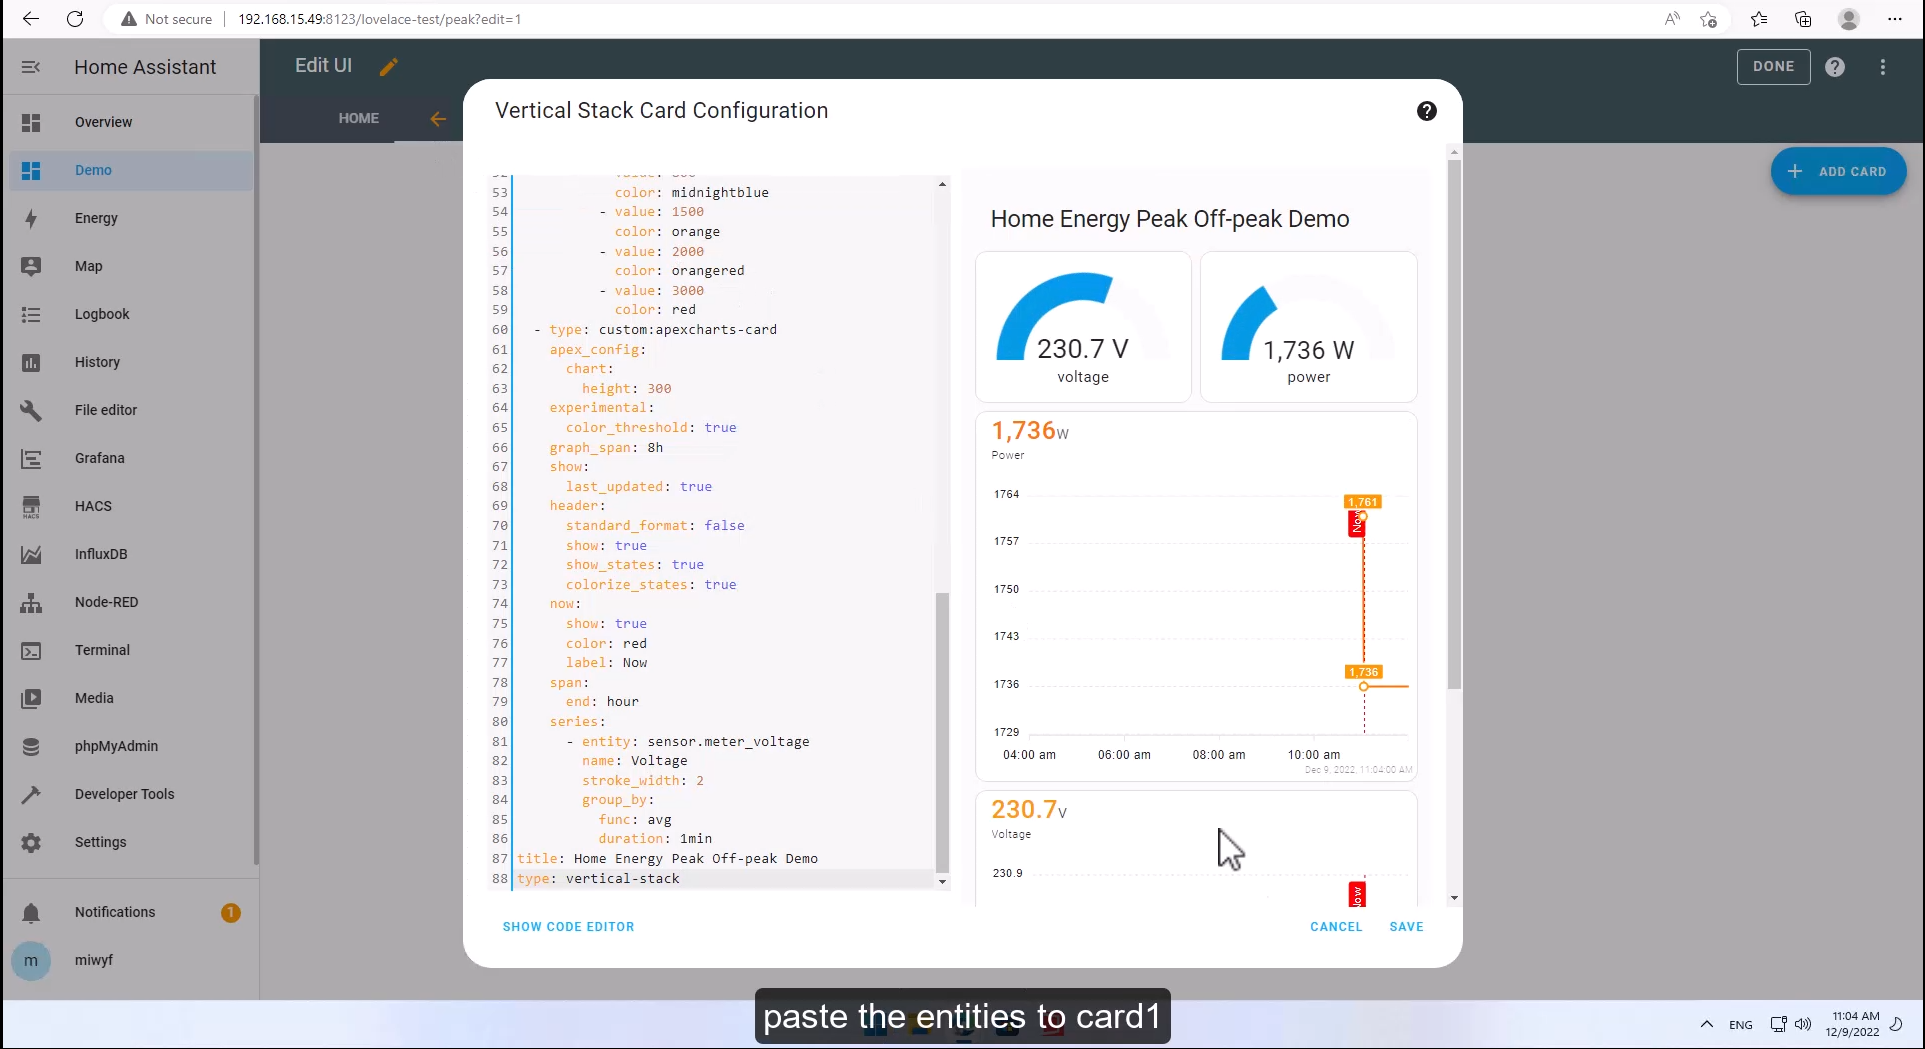
cards:- cards:- entity: sensor.meter_voltagemax: 300min: 100name: voltagetheme: defaulttype: gaugeneedle: false- entity: sensor.meter_powermax: 5000min: 0name: powertheme: defaulttype: gaugeneedle: falsetype: horizontal-stack- type: custom:apexcharts-cardapex_config:chart:height: 300experimental:color_threshold: truegraph_span: 8hshow:last_updated: trueheader:standard_format: falseshow: trueshow_states: truecolorize_states: truenow:show: truecolor: redlabel: Nowspan:end: hourseries:- entity: sensor.meter_powername: Powertype: linegroup_by:func: avgduration: 1mstroke_width: 2show:extremas: trueheader_color_threshold: truecolor_threshold:- value: 100color: steelblue- value: 800color: midnightblue- value: 1500color: orange- value: 2000color: orangered- value: 3000color: red- type: custom:apexcharts-cardapex_config:chart:height: 300experimental:color_threshold: truegraph_span: 8hshow:last_updated: trueheader:standard_format: falseshow: trueshow_states: truecolorize_states: truenow:show: truecolor: redlabel: Nowspan:end: hourseries:- entity: sensor.meter_voltagename: Voltagestroke_width: 2group_by:func: avgduration: 1mintitle: Home Energy Peak Off-peak Demotype: vertical-stack
Card2
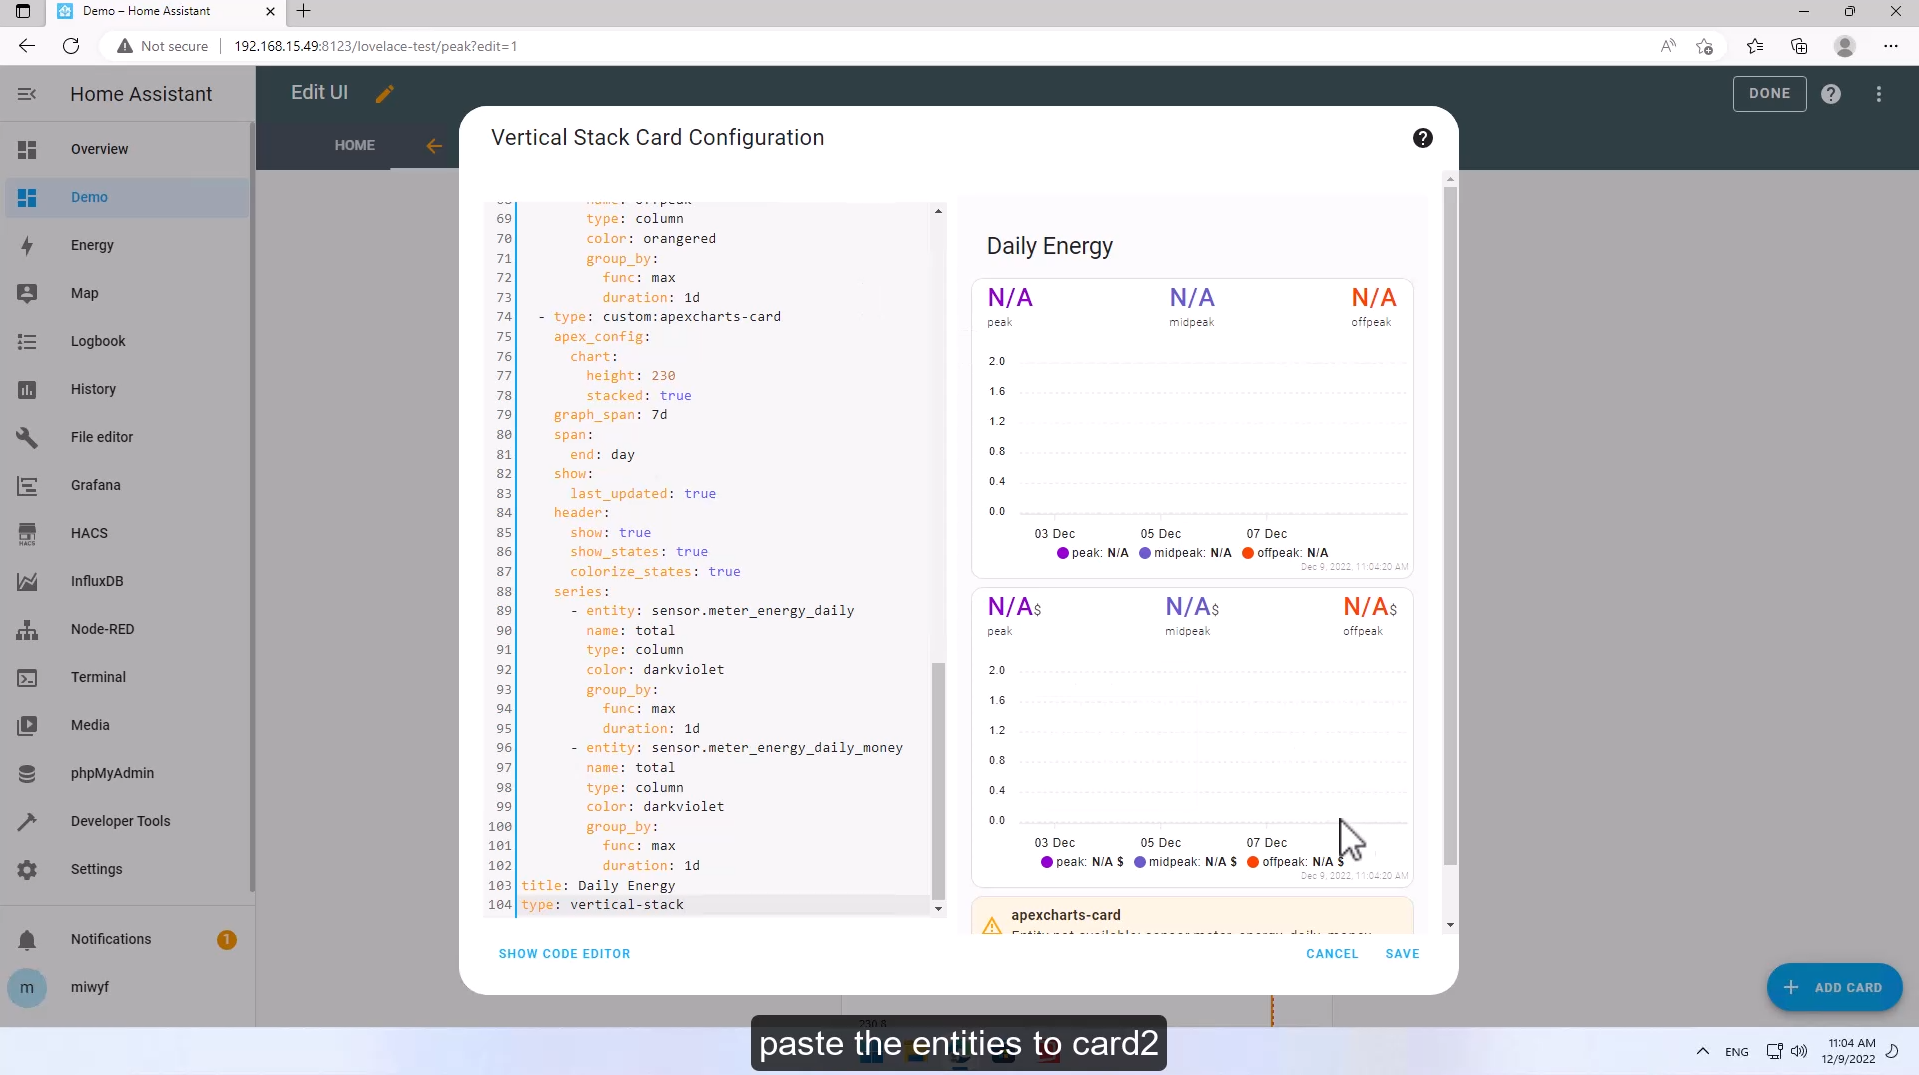
cards:- type: custom:apexcharts-cardapex_config:chart:height: 230stacked: truegraph_span: 7dspan:end: dayshow:last_updated: trueheader:show: trueshow_states: truecolorize_states: trueseries:- entity: sensor.daily_energy_peakname: peaktype: columncolor: darkvioletgroup_by:func: maxduration: 1d- entity: sensor.daily_energy_midpeakname: midpeaktype: columncolor: slatebluegroup_by:func: maxduration: 1d- entity: sensor.daily_energy_offpeakname: offpeaktype: columncolor: orangeredgroup_by:func: maxduration: 1d- type: custom:apexcharts-cardapex_config:chart:height: 230stacked: truegraph_span: 7dspan:end: dayshow:last_updated: trueheader:show: trueshow_states: truecolorize_states: trueseries:- entity: sensor.daily_energy_peak_moneyname: peaktype: columncolor: darkvioletgroup_by:func: maxduration: 1d- entity: sensor.daily_energy_midpeak_moneyname: midpeaktype: columncolor: slatebluegroup_by:func: maxduration: 1d- entity: sensor.daily_energy_offpeak_moneyname: offpeaktype: columncolor: orangeredgroup_by:func: maxduration: 1d- type: custom:apexcharts-cardapex_config:chart:height: 230stacked: truegraph_span: 7dspan:end: dayshow:last_updated: trueheader:show: trueshow_states: truecolorize_states: trueseries:- entity: sensor.meter_energy_dailyname: totaltype: columncolor: darkvioletgroup_by:func: maxduration: 1d- entity: sensor.meter_energy_daily_moneyname: totaltype: columncolor: darkvioletgroup_by:func: maxduration: 1dtitle: Daily Energytype: vertical-stack
Card3
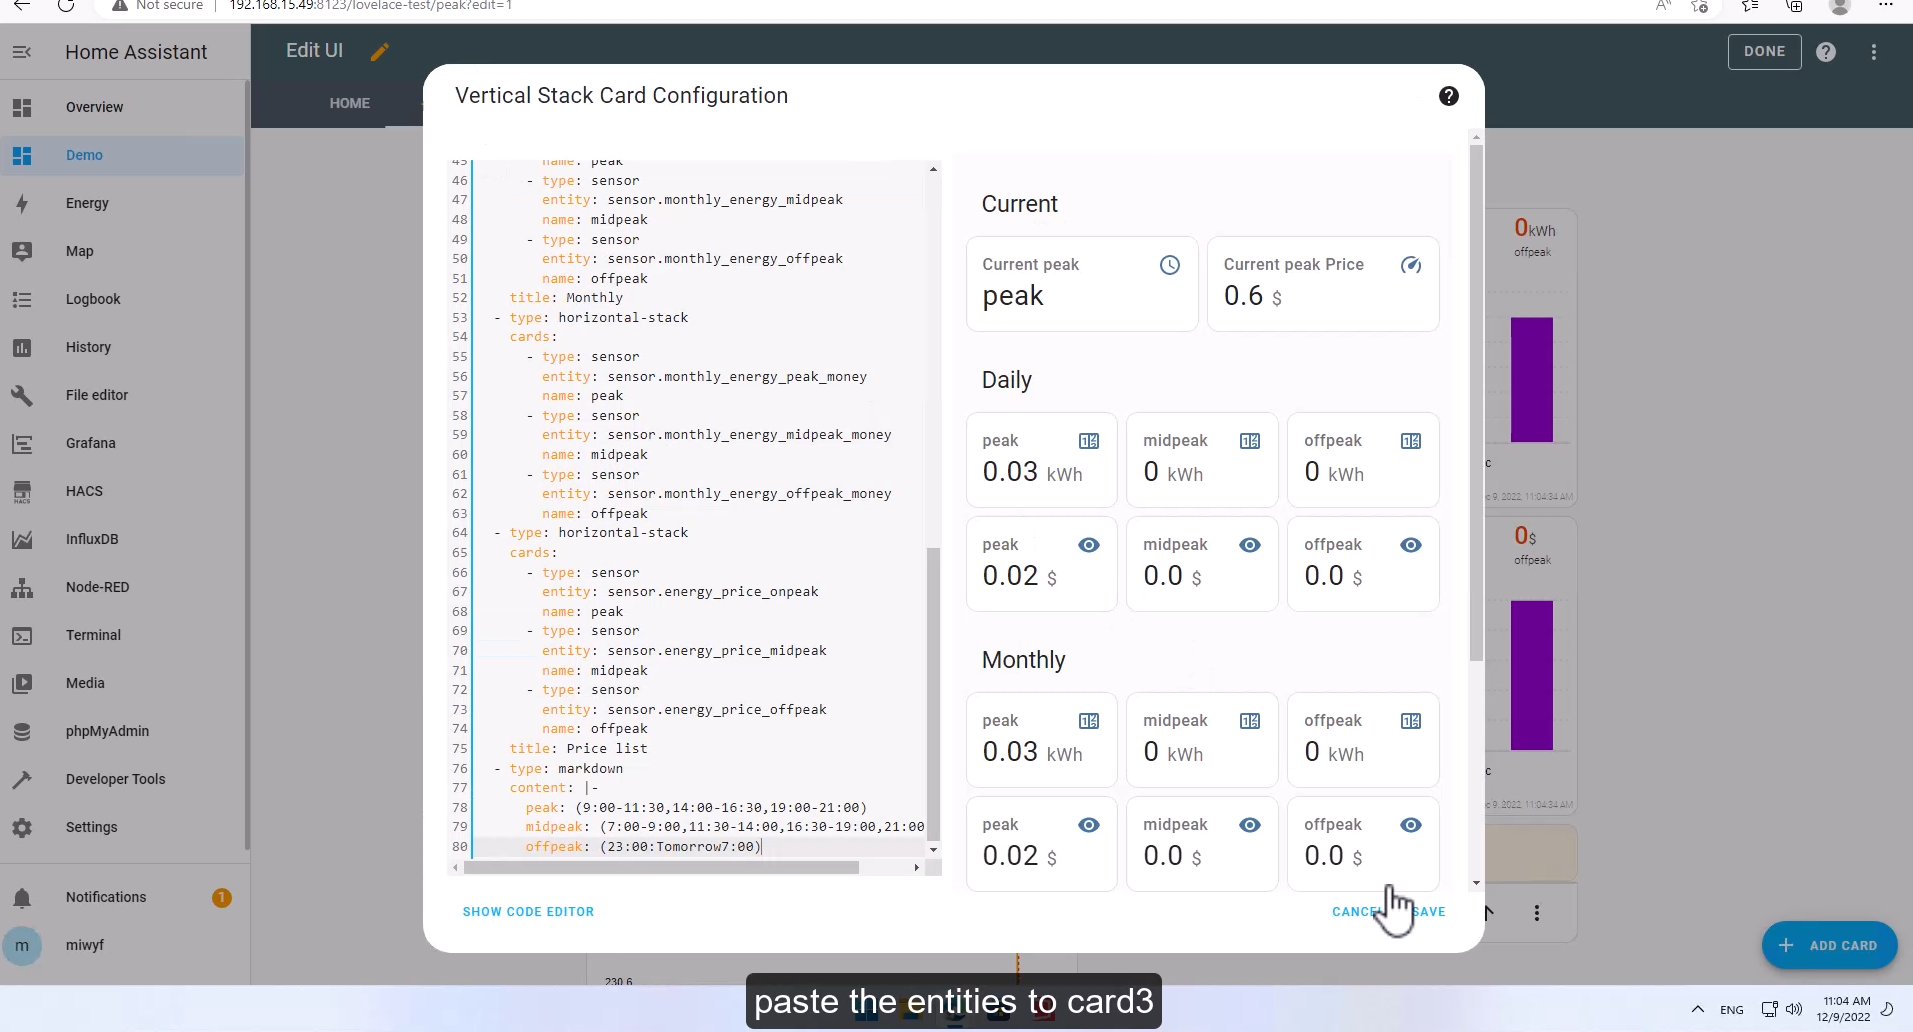
type: vertical-stackcards:- type: horizontal-stackcards:- type: entityentity: select.daily_energystate_color: falsename: Current peak- hours_to_show: 24graph: nonetype: sensorentity: sensor.energy_price_currentdetail: 1title: Current- type: horizontal-stackcards:- type: sensorentity: sensor.daily_energy_peakname: peak- type: sensorentity: sensor.daily_energy_midpeakname: midpeak- type: sensorentity: sensor.daily_energy_offpeakname: offpeaktitle: Daily- type: horizontal-stackcards:- hours_to_show: 24graph: nonetype: sensorentity: sensor.daily_energy_peak_moneyname: peakdetail: 1- type: sensorentity: sensor.daily_energy_midpeak_moneyname: midpeak- type: sensorentity: sensor.daily_energy_offpeak_moneyname: offpeak- type: horizontal-stackcards:- type: sensorentity: sensor.monthly_energy_peakname: peak- type: sensorentity: sensor.monthly_energy_midpeakname: midpeak- type: sensorentity: sensor.monthly_energy_offpeakname: offpeaktitle: Monthly- type: horizontal-stackcards:- type: sensorentity: sensor.monthly_energy_peak_moneyname: peak- type: sensorentity: sensor.monthly_energy_midpeak_moneyname: midpeak- type: sensorentity: sensor.monthly_energy_offpeak_moneyname: offpeak- type: horizontal-stackcards:- type: sensorentity: sensor.energy_price_onpeakname: peak- type: sensorentity: sensor.energy_price_midpeakname: midpeak- type: sensorentity: sensor.energy_price_offpeakname: offpeaktitle: Price list- type: markdowncontent: |-peak: (9:00-11:30,14:00-16:30,19:00-21:00)midpeak: (7:00-9:00,11:30-14:00,16:30-19:00,21:00-23:00)offpeak: (23:00:Tomorrow7:00)

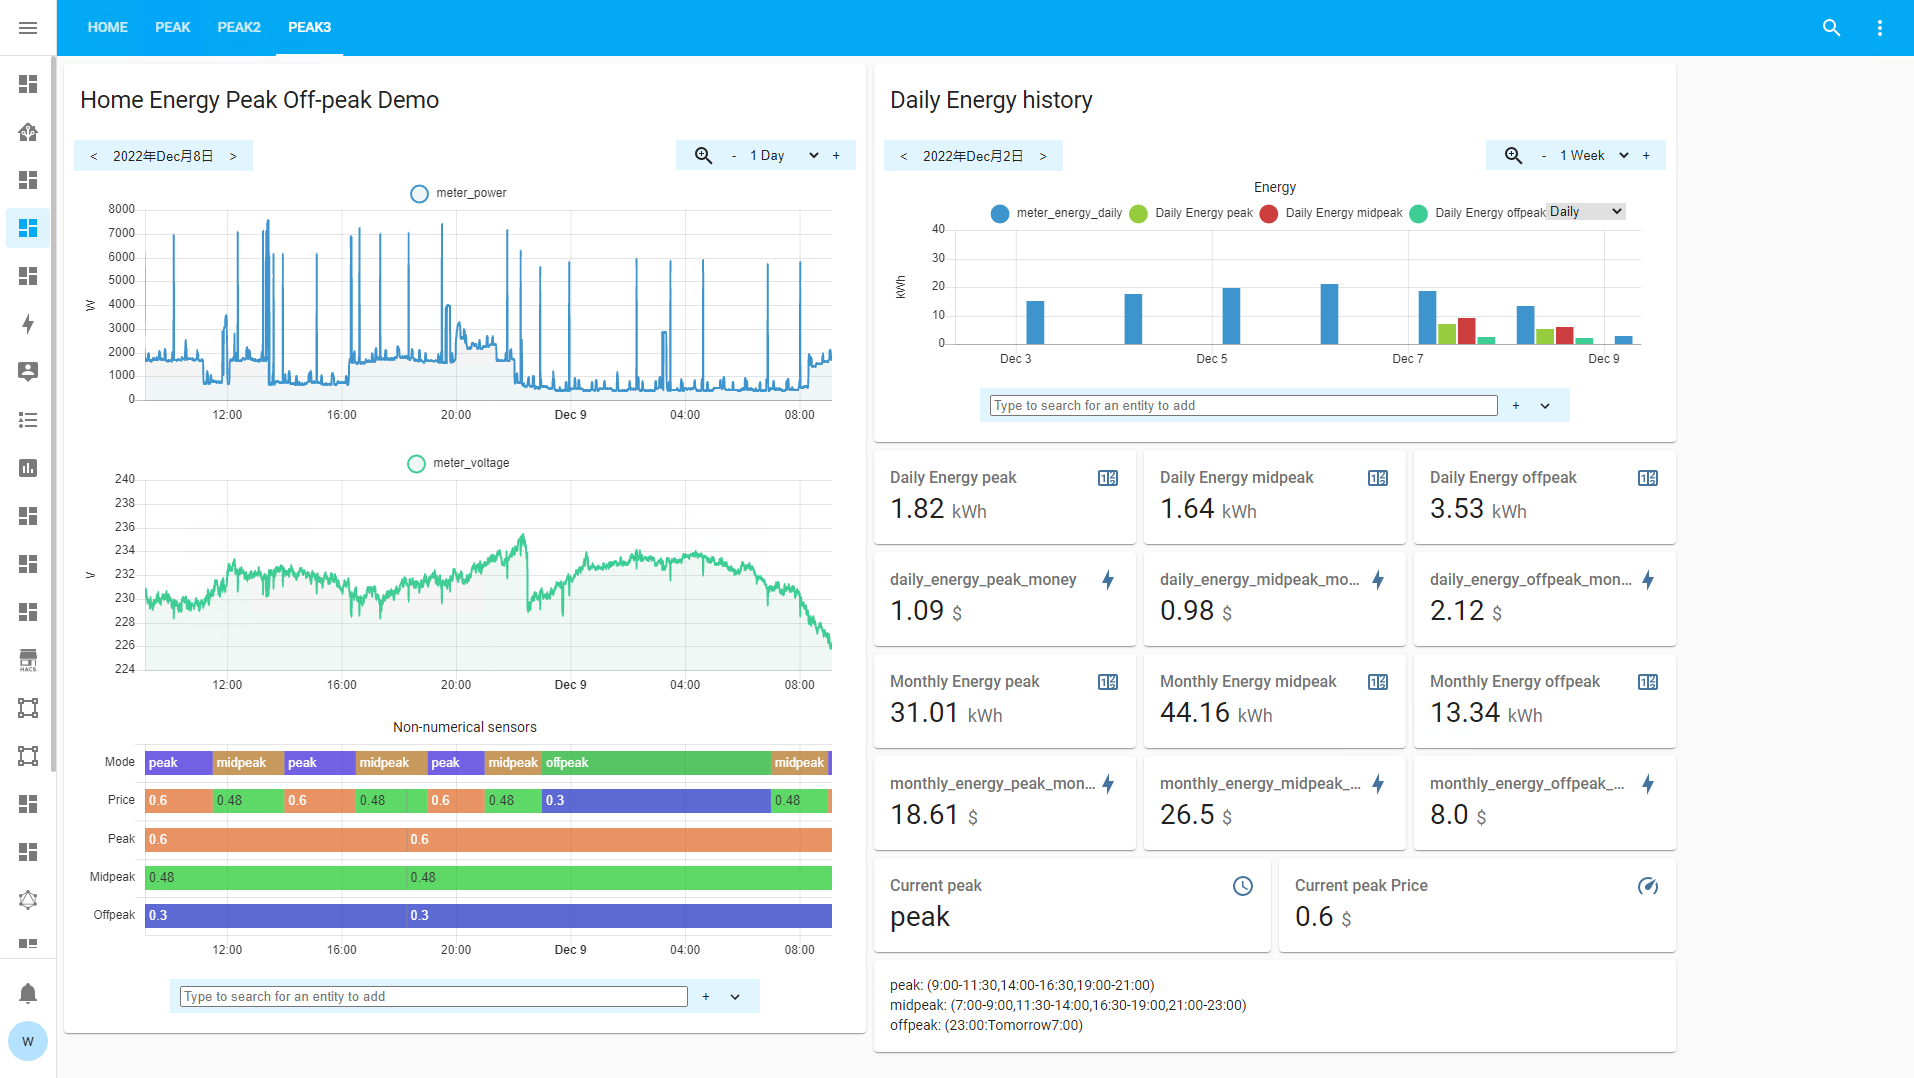
effect2:
peak3, Sidebar
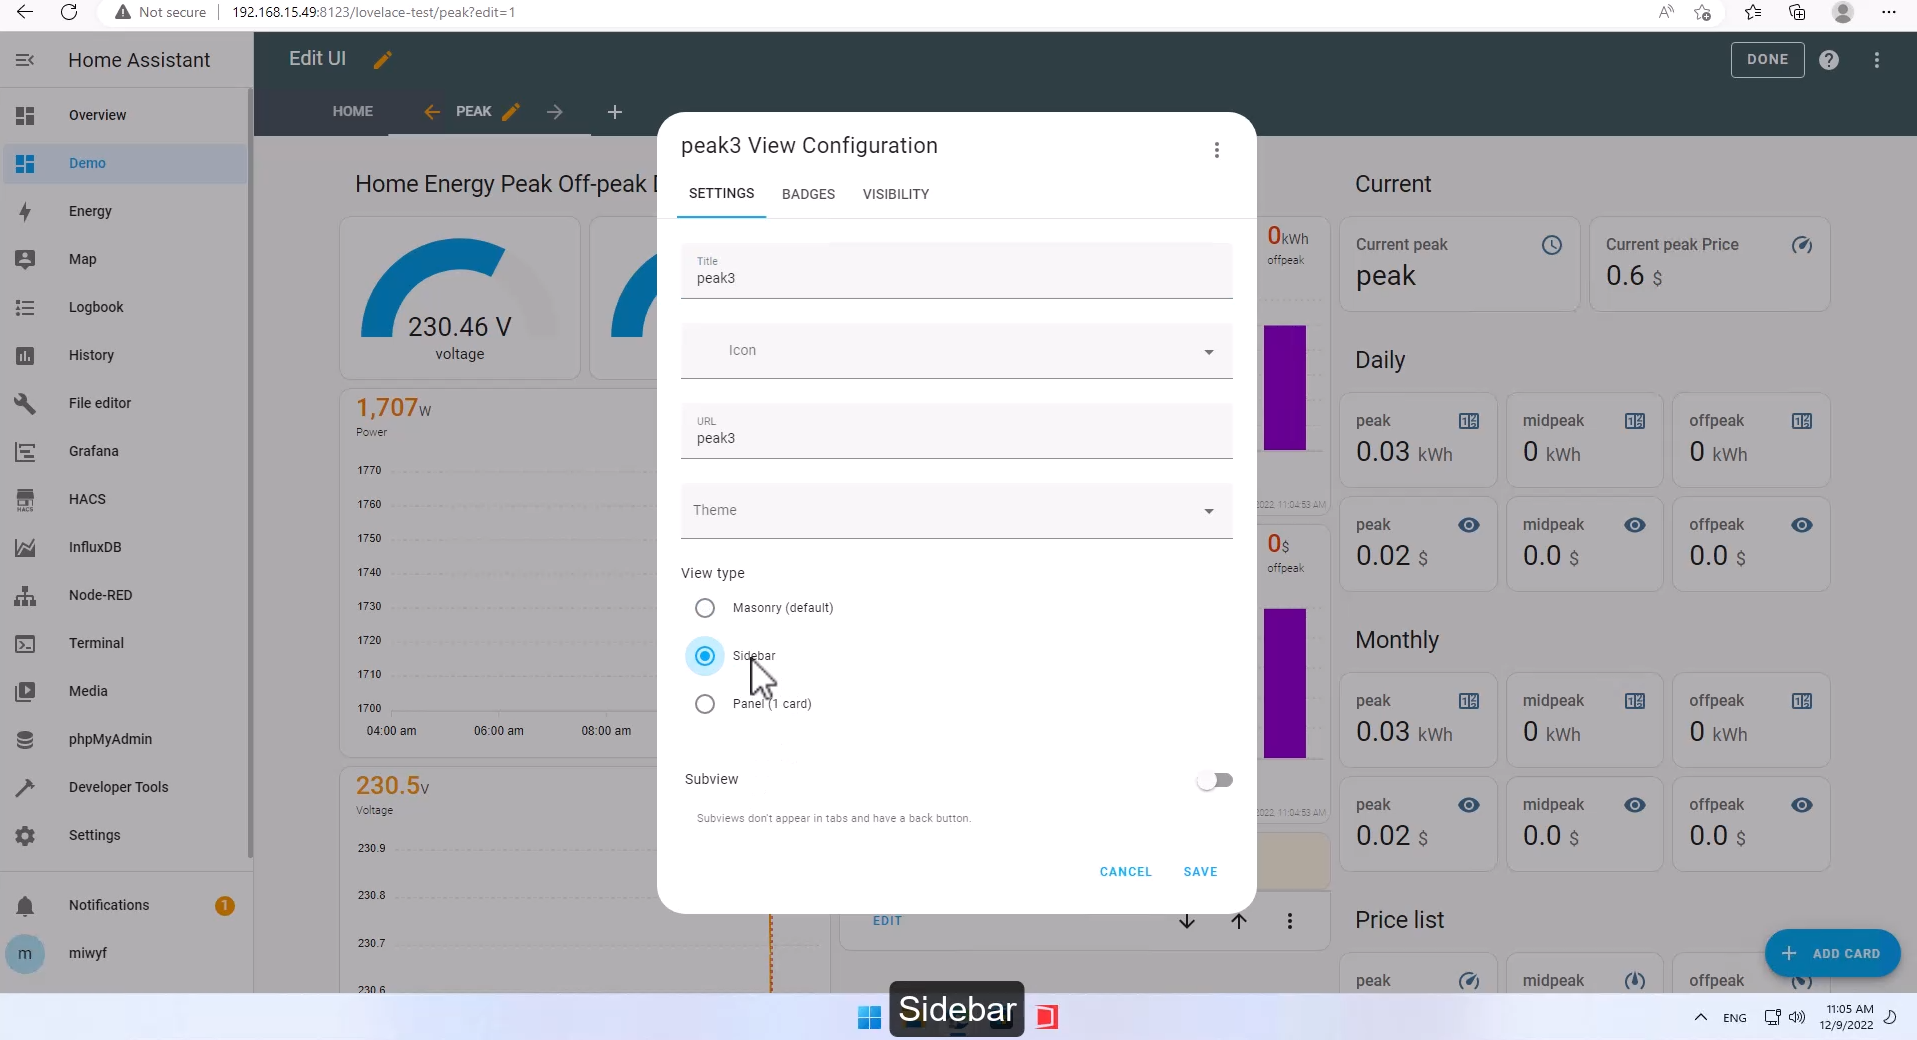
Card
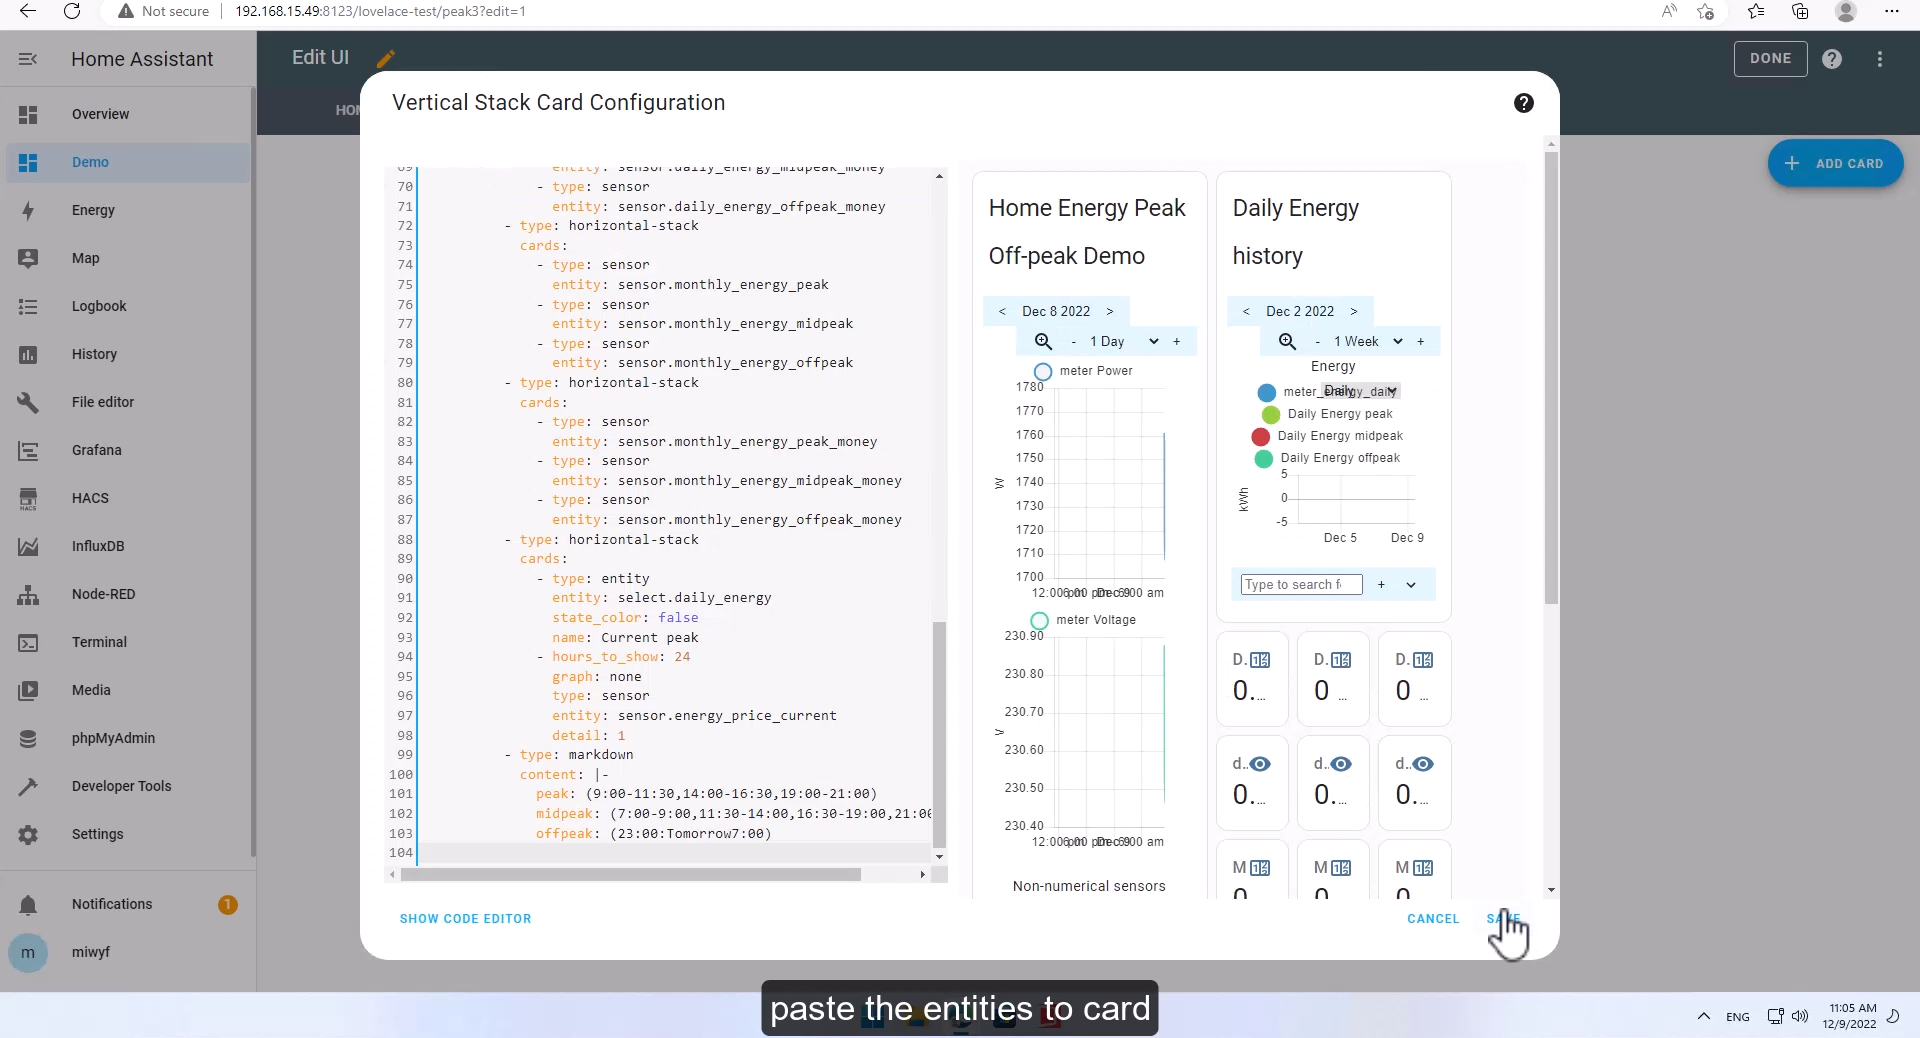
type: vertical-stackcards:- type: horizontal-stackcards:- type: vertical-stackcards:- type: custom:history-explorer-cardheader: Home Energy Peak Off-peak DemouiLayout:invertZoom: truegraphs:- type: lineentities:- entity: sensor.meter_powercolor: '#3e95cd'fill: rgba(151,187,205,0.15)- type: lineentities:- entity: sensor.meter_voltagecolor: '#3ecd95'fill: rgba(151,205,187,0.15)- type: timelinetitle: Non-numerical sensorsentities:- entity: select.daily_energyname: Mode- entity: sensor.energy_price_currentname: Price- entity: sensor.energy_price_onpeakname: Peak- entity: sensor.energy_price_midpeakname: Midpeak- entity: sensor.energy_price_offpeakname: Offpeak- type: vertical-stackcards:- type: custom:history-explorer-carddefaultTimeRange: 1wheader: Daily Energy historyuiLayout:invertZoom: truegraphs:- type: bartitle: Energyoptions:interval: dailyentities:- entity: sensor.meter_energy_dailyscale: 0.5- entity: sensor.daily_energy_peakscale: 0.5- entity: sensor.daily_energy_midpeakscale: 0.5- entity: sensor.daily_energy_offpeakscale: 0.5- type: horizontal-stackcards:- type: sensorentity: sensor.daily_energy_peak- type: sensorentity: sensor.daily_energy_midpeak- type: sensorentity: sensor.daily_energy_offpeak- type: horizontal-stackcards:- type: sensorentity: sensor.daily_energy_peak_money- type: sensorentity: sensor.daily_energy_midpeak_money- type: sensorentity: sensor.daily_energy_offpeak_money- type: horizontal-stackcards:- type: sensorentity: sensor.monthly_energy_peak- type: sensorentity: sensor.monthly_energy_midpeak- type: sensorentity: sensor.monthly_energy_offpeak- type: horizontal-stackcards:- type: sensorentity: sensor.monthly_energy_peak_money- type: sensorentity: sensor.monthly_energy_midpeak_money- type: sensorentity: sensor.monthly_energy_offpeak_money- type: horizontal-stackcards:- type: entityentity: select.daily_energystate_color: falsename: Current peak- hours_to_show: 24graph: nonetype: sensorentity: sensor.energy_price_currentdetail: 1- type: markdowncontent: |-peak: (9:00-11:30,14:00-16:30,19:00-21:00)midpeak: (7:00-9:00,11:30-14:00,16:30-19:00,21:00-23:00)offpeak: (23:00:Tomorrow7:00)

Reference
How to use IAMMETER`s energy meter into the home assistant
IAMMETER supports more power tariff templates(fixed, tiered,time of use etc...)
