Hello,
I have a 3080T, solar panels...and an energy router which when the solar panels generate more energy than what I consume diverts this excess energy to my hot water tank.
I could put the "battery" TC on the electric resistance of my hot water tank, in this case, in the daily graph I can see the energy redirected to the hot water tank (battery power), but I don't see more of this energy in the hourly, monthly or annual report... located below.
Couldn't we add in the "energy balance" tab "power to the battery"? so I could see day by day and month by month the power diverted by my solar router
I am convinced that many users would be interested in this development.
Could you help me ?

Hi:
Sorry, I am a little confused about the relationship between battery and " hot water tank".
1 Please give us more explanation about this usage in a simple sketch map.
2 "in the daily graph I can see the energy redirected to the hot water tank (battery power)"
Please give us a specific example (a snapshot of the graph that includes real data) to let us know how do you find "the energy redirected to the hot water tank".
Good morning,
Indeed, my explanation was not very clear.
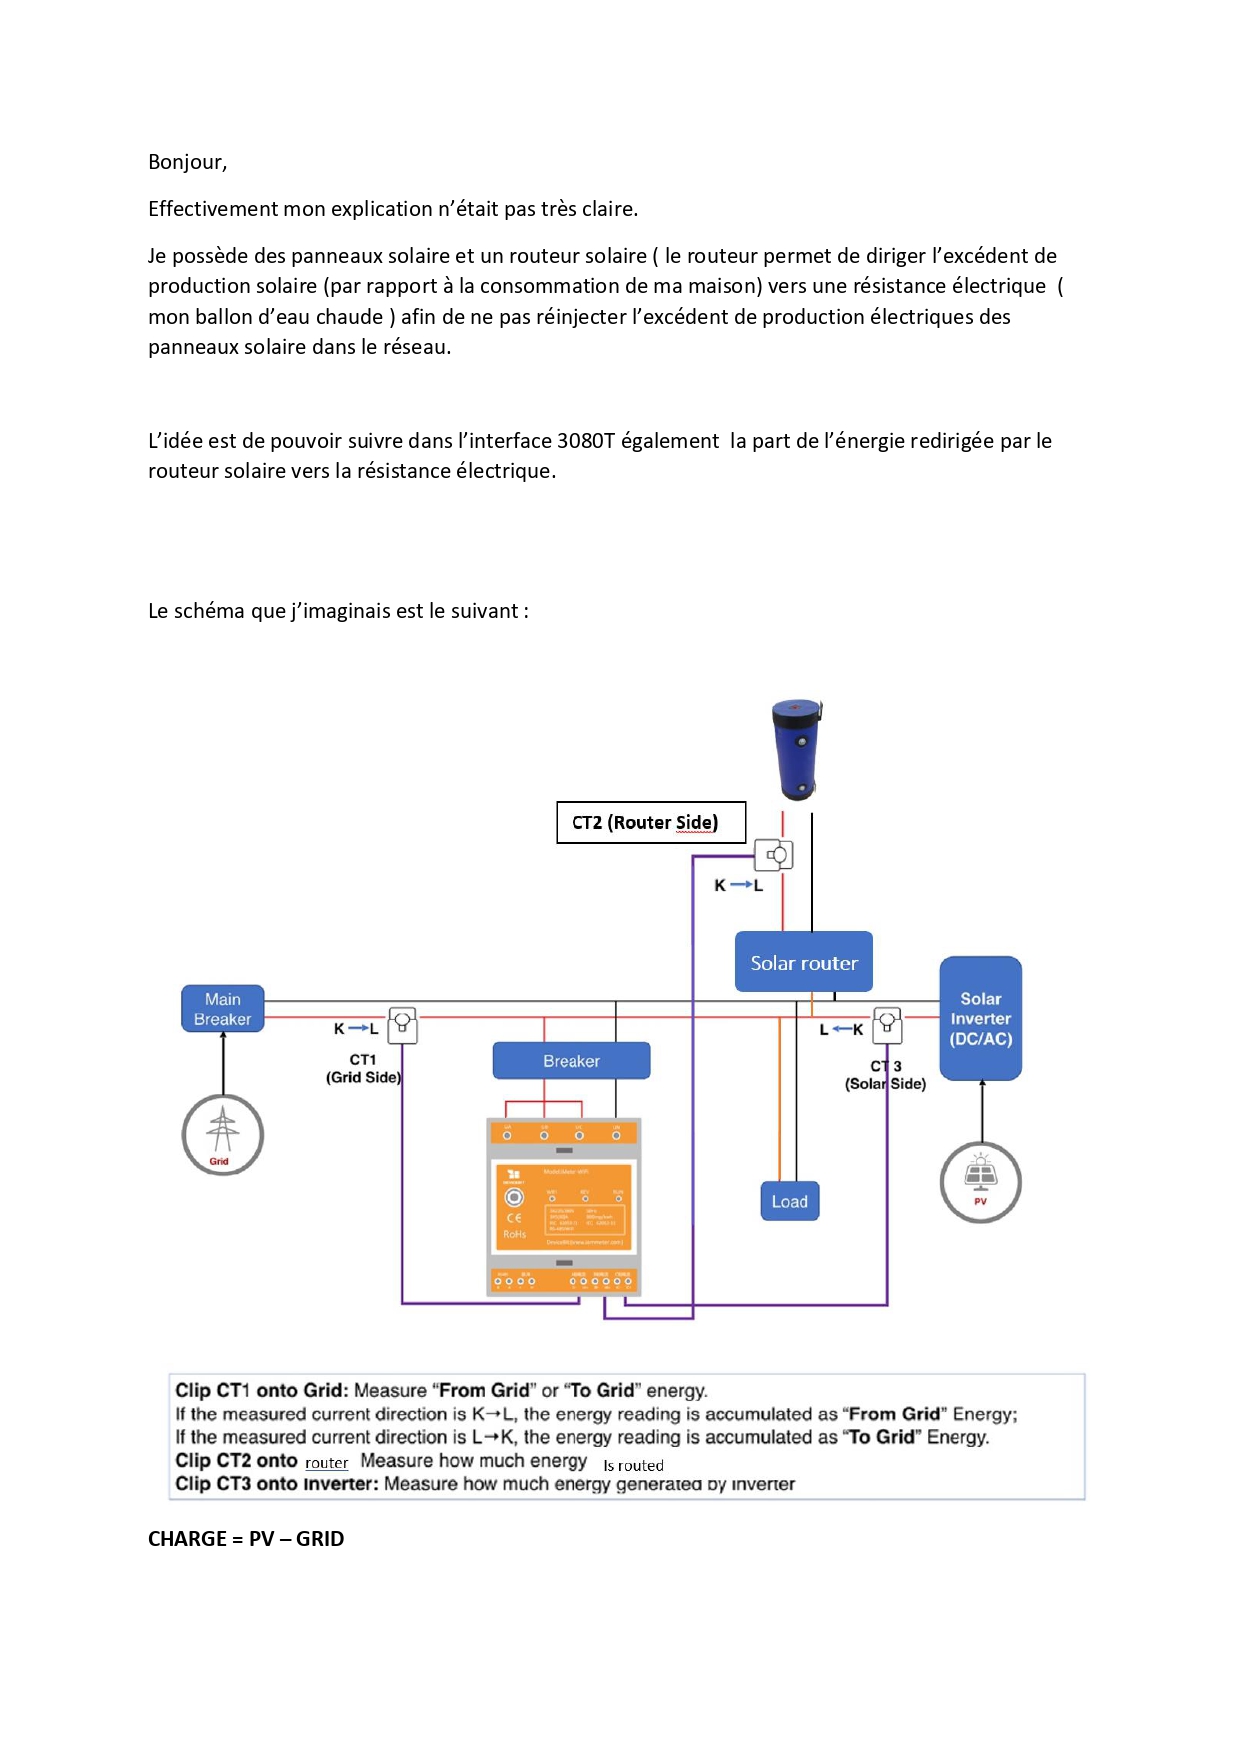
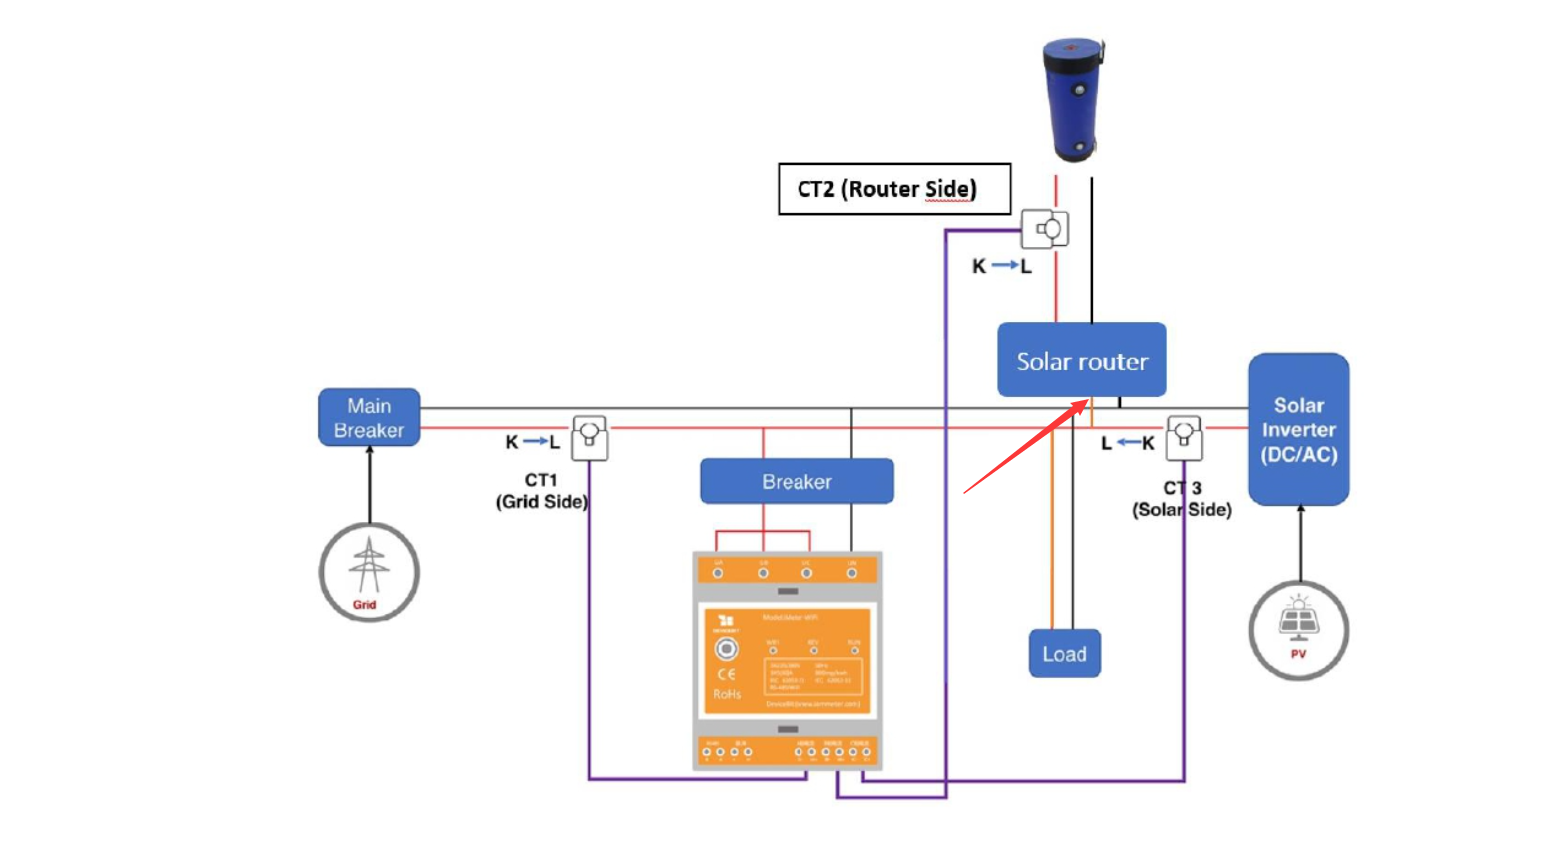
I have solar panels and a solar router (the router allows to direct the excess of solar production (compared to the consumption of my house) towards an electrical resistance ( my hot water balloon ) So as not to re-inject the excess electricity production of solar panels into the grid.
The idea is to be able to track in the 3080T interface also the share of energy redirected by the solar router to the electrical resistance.
The pattern I envisioned is this: see photos
Is that clearer now?
possible?
Hi:
Whether the blue one (in red rectangle) is the "hot water tank"?
If so, is it a normal load.(220V,50hz)?
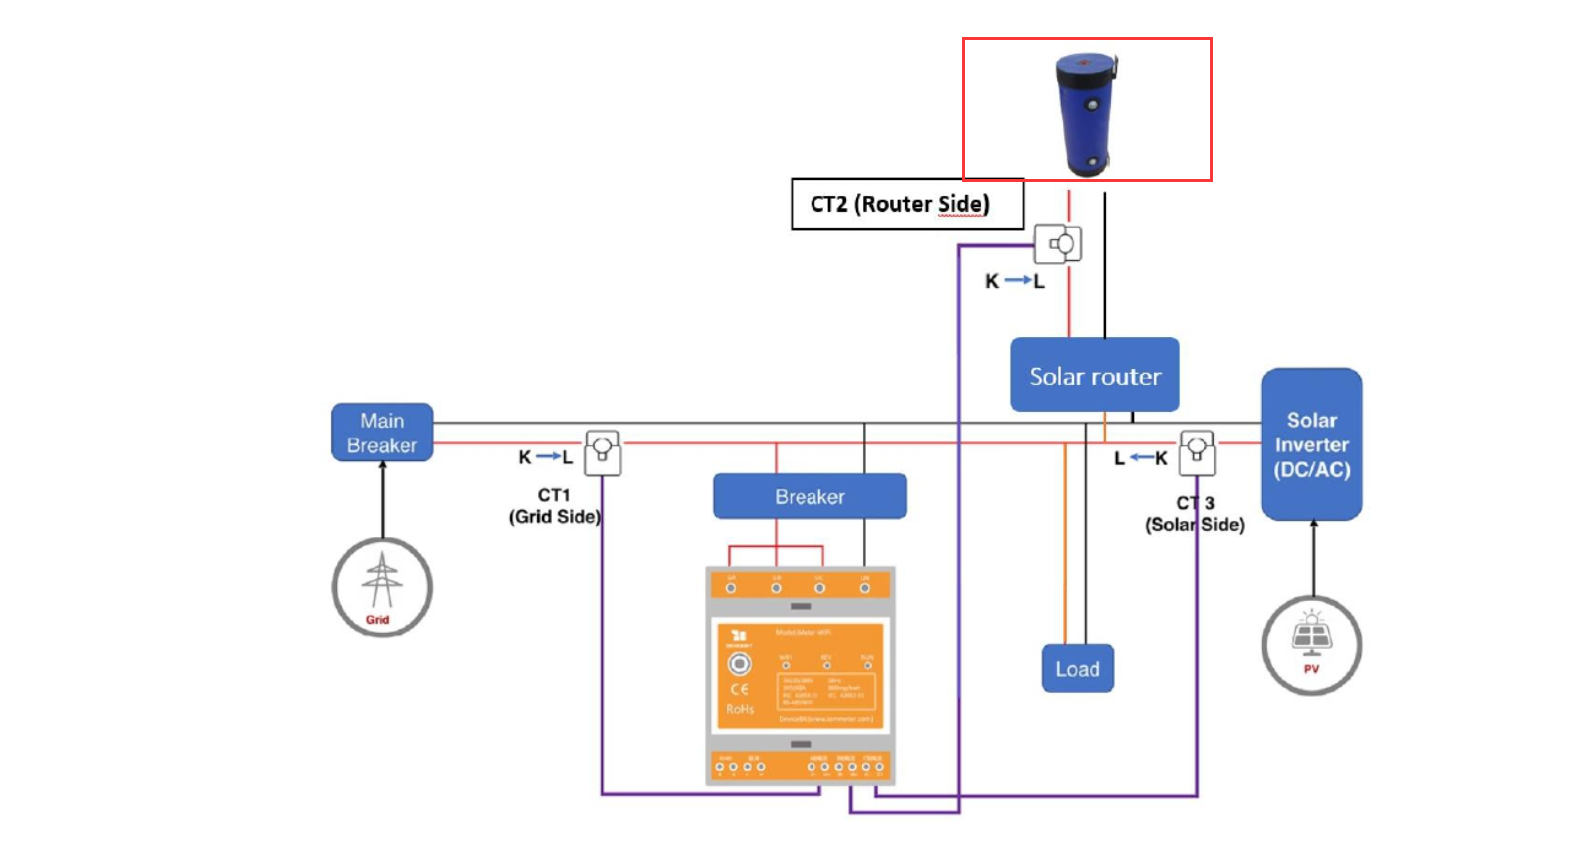
If it is a normal load(220V,5ohz) , you can clamp the CT in this position and select the meter type of "load" in IAMMETER system.

Hello,
Indeed, the red rectangle is the hot water tank in 220v / 50Hz!
power at CT2 is always greater than 0
I tried your proposal, I put the CT2 on "charge" in the IAMMETER system.
-> the problem is that I do not see the power "routed" to my hot water tank neither in the daily curves nor in the daily, monthly, annual graphs ....
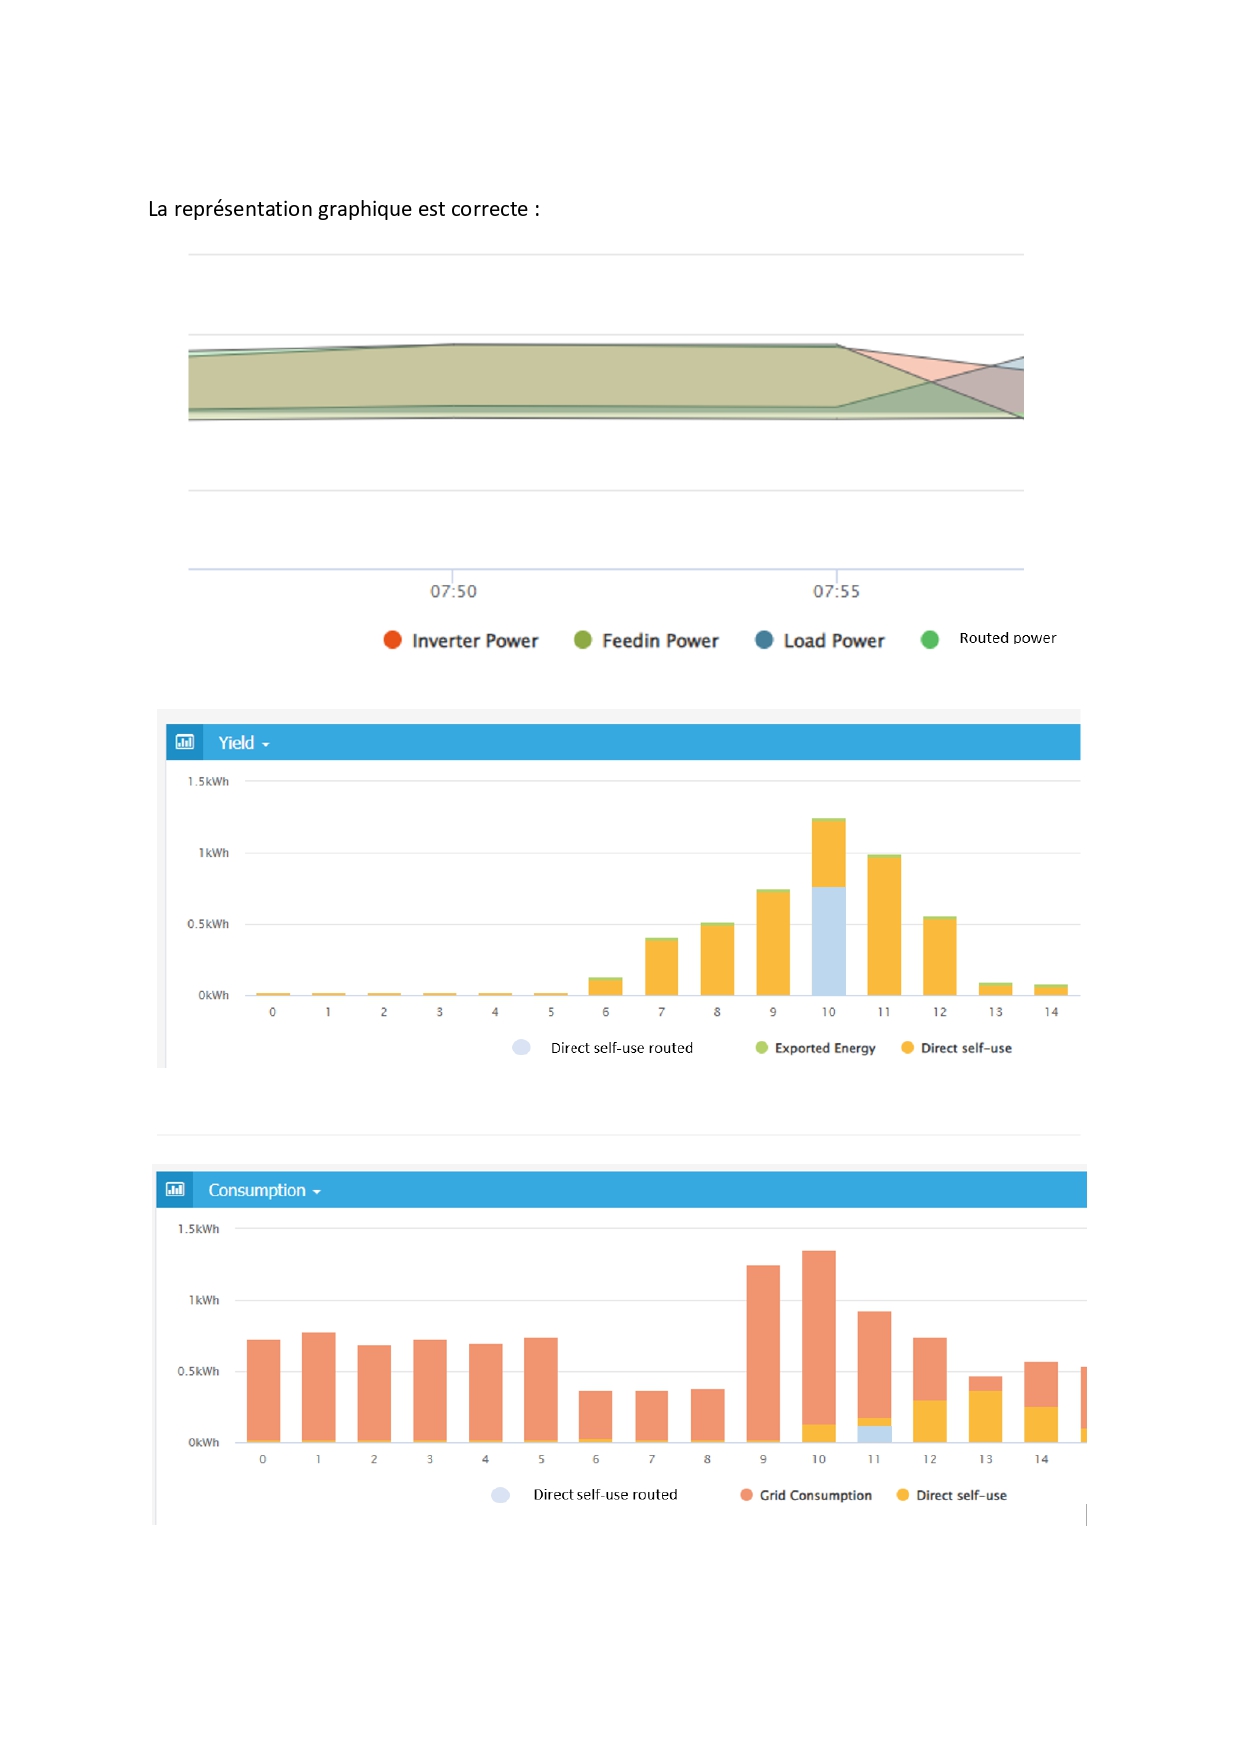
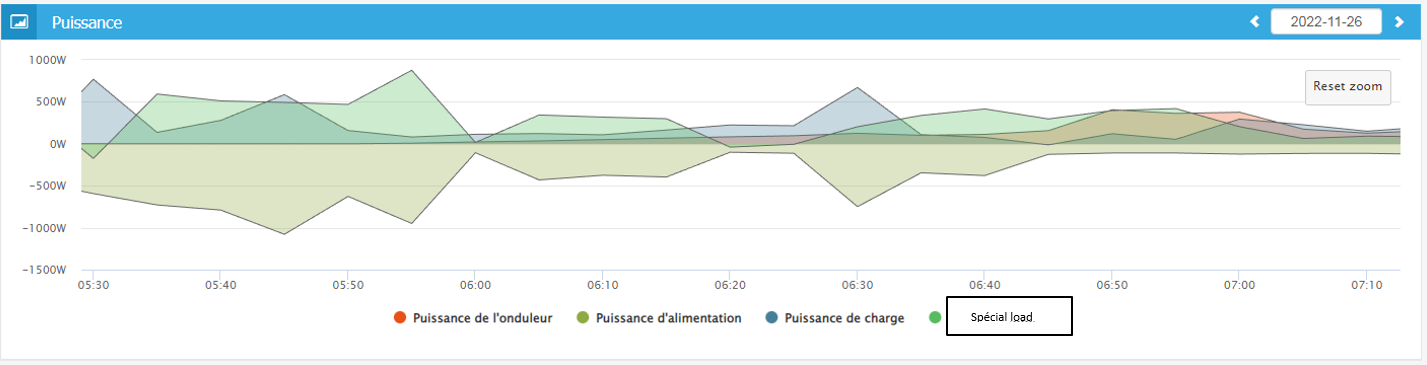
=> Leaving the assembly identical, and putting the CT2 on "AC Storage", I clearly see the power "routed" to my hot water tank (in this case on the daily graph, "battery power" represents the power routed to my hot water tank).
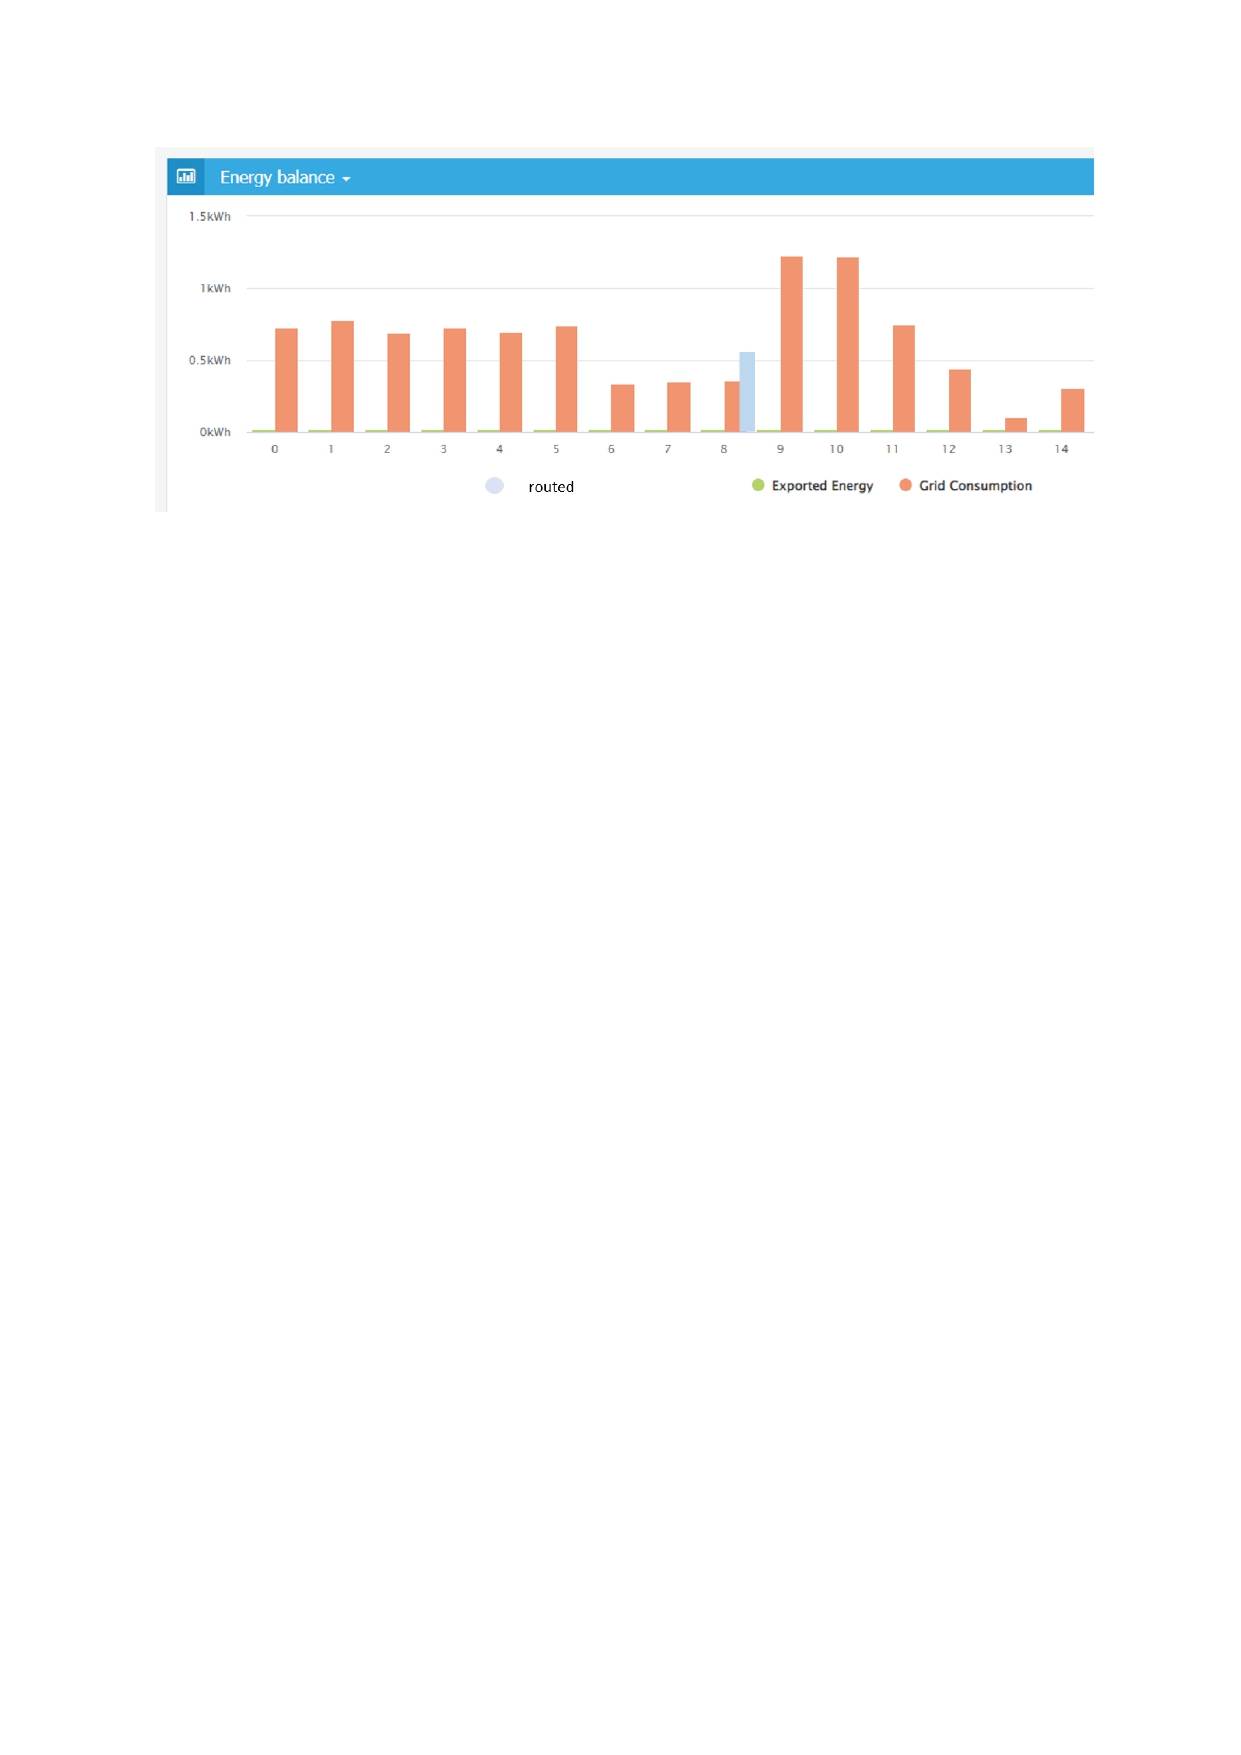
The problem is that I still do not see the power "routed" to my hot water tank or in the daily, monthly, annual graphs .... (see the attached proposal graphs).
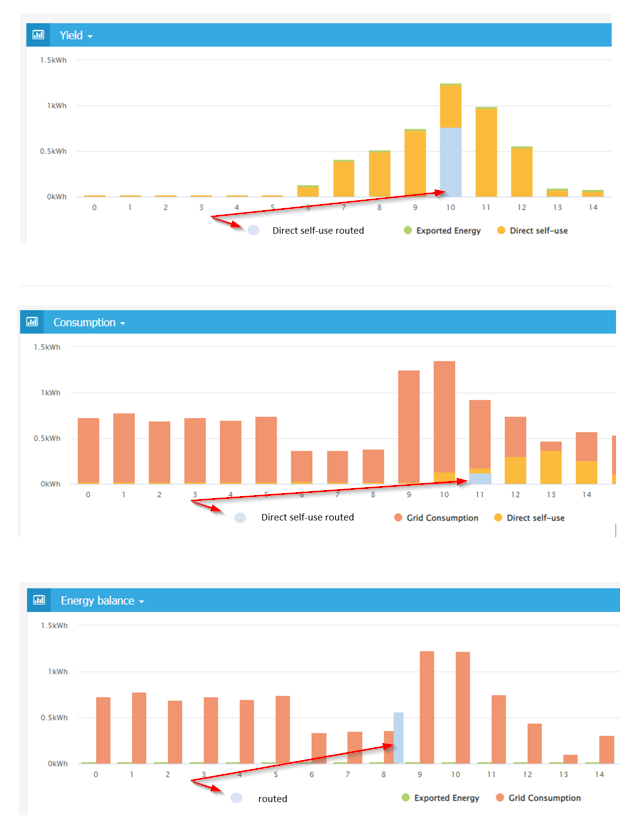
The principle of my idea (and of all the people who have an energy router) would be to display the power routed (current "battery power") to the hot water tank in the daily, monthly, annual graphs. This routed power is part of self-consumption since the router only directs the excess energy from the solar panels and thus optimizes self-consumption as close as possible to 100%.
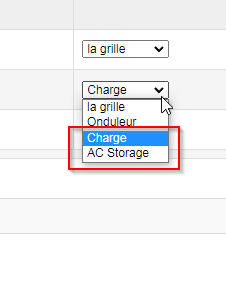
It would probably be possible to add in the drop-down menu of the 3080T parameters the "router" option (see attachments) so in the graphics we could have "power routed" instead of "battery power" right?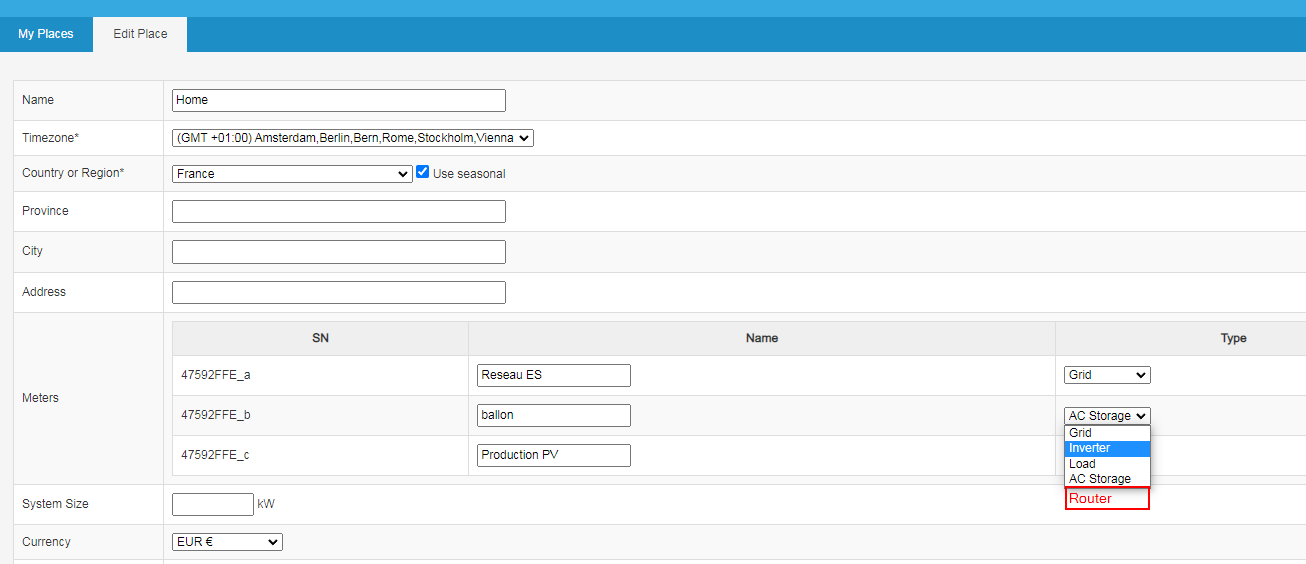
Thanks !
Vincent
Hi:
Thanks for your suggestion. I try to conclude my understanding, please help us to confirm one by one.
1 the solar router is one kindes of "AC storage".
2 The "solar router" can be connected to many loads, but you only add one load ("hot water tank") now.
3 if you use the meter type of "ac storage" , it can meet a part of your requirements, the fundamental problem is there is not a part in the graph that describes the daily monthly of the "AC storage" kWh.
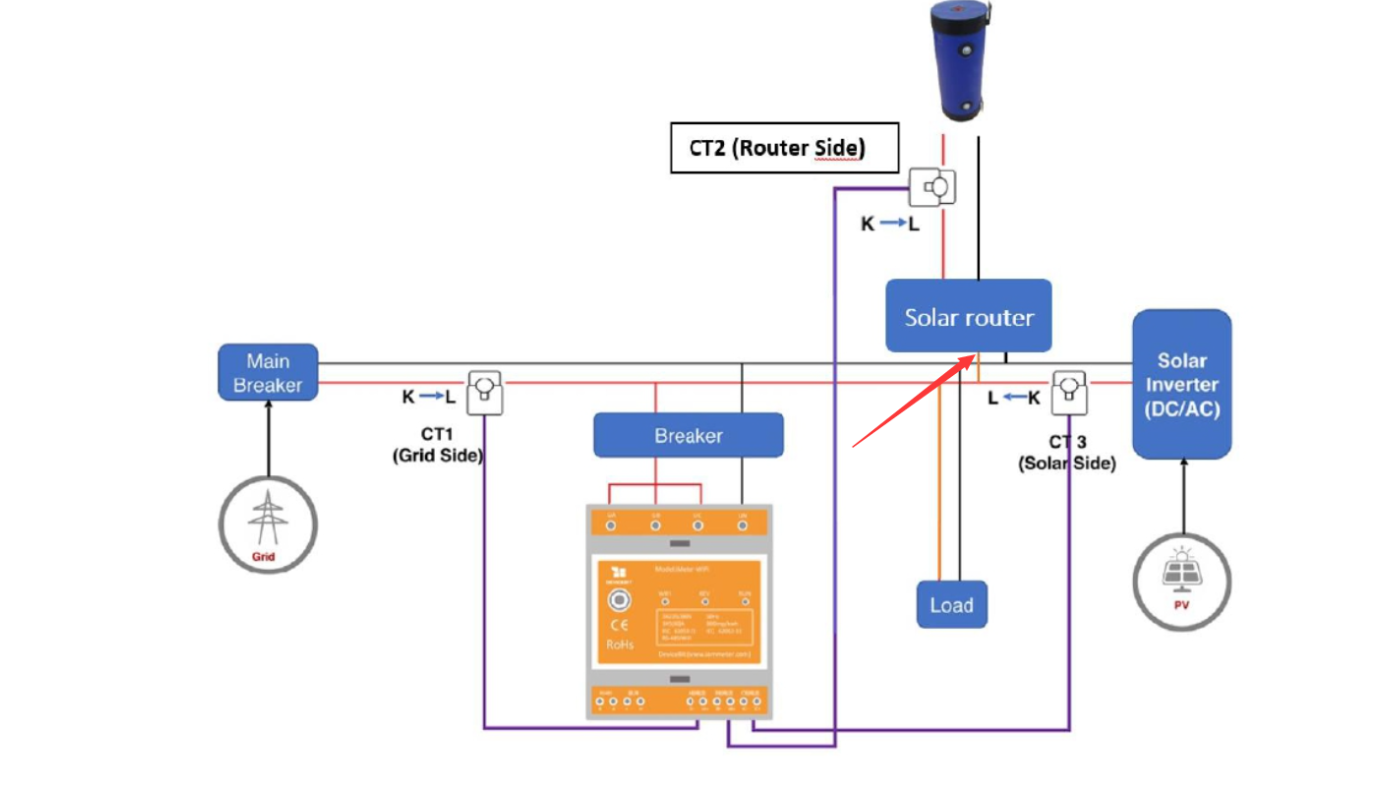
4 Please let me know, why do not install the ct2 in this position(before the solar router?)
Hello,
Thank you for your comeback.
1/ yes, the router can be compared to "AC Storage"
2/ yes
3/ exactly
4/ I could also put the CT before the router, it's the same.
Thanks !
Vincent
OK, I will forward this issue to my colleague in the product department.
BR
Just be ware that some of these "diverters" or "routers" as you have called might or might not read correctly with the Iammeter if you put it between the router and the HWS. If the router is a very simple device that turns on a relay when there is enough power to drive the full load of the HWS, then it will probably be ok where you have put it. But if it is the more feature rich type that can put incrementally as much or as little spare power as is available, then the Iammeter might not read this correctly (eg if you have 100W of spare power, it can router 100W, and only 100W to the HWS). I will let the guys who have designed it confirm, but if it is the later type, you will probably not always be giving your HWS 220V / 50Hz sine wave (or whatever the nominal voltage of your supply as read by the voltage sense from the supply in the meter).
The issue would be that the CT clamps only measure current. They would calculate power but doing some maths with the current measured by the CT clamp and multiplying this by the voltage they they measure at the meter from the wires you have connected to power the meter (this is very much a simplification but close enough for this explanation). So if the unmeasured voltage is different at the CT clamps to the meter, it will give false readings. I specifically meantion this for "diverters" so the better once can supply the incremental power, less than full load by a number of technics that I suspect will likely stuff up your readings (eg if you have 500W of free solar than can put just 500W to the HWS and do 360W of heating even though the element is probably 3.6kW or similar). For example 1 diverter I know does this by varying the voltage. So they put a lower voltage which will result in a lower power into HWS. The Iammeter will then be doing a calculation with the wrong voltage which will give you an inaccuate reading when the diverter does not have enough spare solar to give the HWS full power.
The other way that they might do it is with something like a triac, commonly used in light dimmers. They way these work to reduce power is to cut a part of the sine wave off early or late (so you end up with a chopped up sine wave. If it is this type, it will no longer be presenting a sine wave to the HWS and definitely not the same voltage at the meter sees. And again, I would full expect this to stuff up the P=VI calculation in the meter as the V will be different at the meter than the clamp.
I am pretty sure this would be exactly what @laoliu is aluding to in his questions and the diagram suggesting to connect the CT clamp in front of the "router". This will resolve any potential issues with what the "router" is doing to the voltage and sign wave. It will accurately tell you home much power you are putting to the router. If the router is 100% efficient, that will be the same as what you put to the HWS. Nothing is 100% effecient. But it might well be close enough. If you want a clue, if there is no fan, and it runs cool, it will be pretty efficient. If it runs hot, it will be less efficient because that is the only place the efficiency losses can go (ie heat).
If I was doing it, I would just treat it as a load, because this is just a load whereas a battery can store and return power. I see why you are thinking the way you are. Often the sales people will meantion they can be used like a battery to soak up excess solar. But by my way of think that does not make them a battery. And I assume sometimes you will be heat HWS from grid power when it needs to be boosted. But that is just personal preference so good luck with your feature request.
Hello,
Thank you for your exchange, it's always productive to exchange together !
I confirm that the router in my possession is indeed a router of the most feature-rich type that can progressively put as much or as little reserve power as available. It has a TRIAC that reduces power by cutting off part of the sine wave.
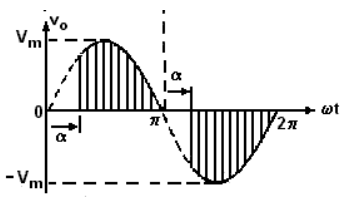
And indeed, since the sine wave is cut, the measurement with the CT must be done BEFORE the router! you are quite right @swainstm, @laoliu .
I made the router myself with an Arduino NANO, I did not go through a reseller .
I also consider the deviated power as a "consumption" but what would be interesting is to be able to visualize separately from the "load" this energy. (we would know then to say that thanks to the router we have "saved more")
Clearly, this does not make it a battery!
yes, I sometimes heat the HWS from the network power supply.
😉 Thanks
The problem if I put the CT2 as "load" is that I do not see the amount of energy gained by the router ....
But it would be possible to represent the additional load on the daily graph and the monthly, annual graphs .... however I think it's more work but it would be more correct indeed!
@laoliu what do you think?
Hi:
First, thanks for the reminder from Swainstm and the answer to Home67.
In fact, the IAMMETER`s energy meter is calibrated at a sine wave with a frequency of 50hz or 60hz.
if you use the energy meter calibrated in 50hz to the system of 60hz(Or the other way round), it will work correctly (the worst would increase the maximum error from 1% to 2%).
But if you install the energy meter behind some devices that vary the frequency or voltage (such as the Variable-frequency Drive), or behind the device change the sine wave output, it would not work correctly anymore.
We would tell our customers who want to monitor the load connected with a Variable-frequency Drive to install the energy metering before the VFD device.
As Swainstm said, installing the energy meter before the VFD(use VFD as the example) needs to consider the efficiency of the VFD.
For example, if the power is 100 kW before the VFD, and the efficiency of the VFD is 97%, then the real load power is 100*0.97 = 97kw.
Honest speaking,I am not familiar with "solar router" before and do not confirm whether it will vary the frequency, voltage, or even sine wave output. so I confirmed with Home67 whether the CT should be installed before the solar router.
Bonjour,
je confirme que la fréquence, la tension ou même la sortie sinusoïdale n'est pas modifiée AVANT le routeur.
Je mettrais le CT2 avant le routeur.
Je comprends que l'efficacité du routeur puisse changer un peu les valeurs, c'est pas trop mal !
😄
Hi:
Please try this report and find out whether it is what you need.
select the meter type to "load" in the phase that used for your solar router
Hello,
YES, this meets my expectations...
Thank you very much for your work.
I could follow the energy diverted to my router.
You have taken the choice to consider this energy as a "load", you are right in fact, it is more accurate like that!
However, I personally, the homepage of the meter gives so much information in case of using a "battery" that if you don't have a battery, but you put the TC2 on a "special load", you don't have so much information.
Is it not possible to make this "special load" appear on this graph? :
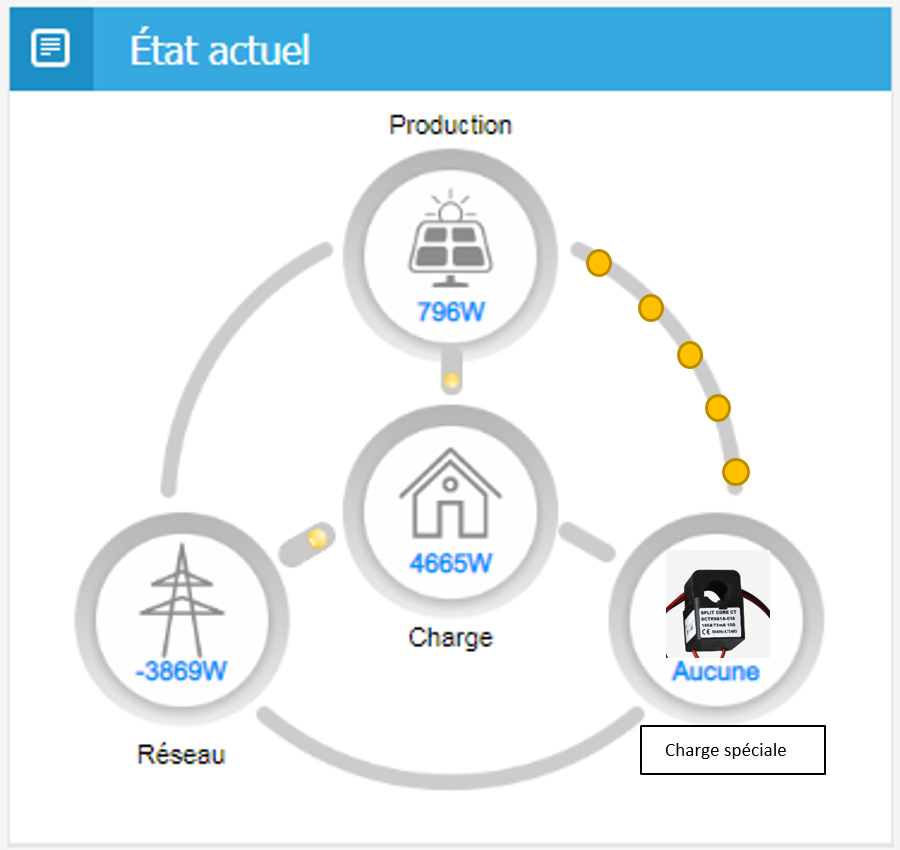
And especially what would be great is to see the "special load" in this beautiful synoptic that you have created and which is very very telling!
Make "special load" appear when you select "load" and make "battery" appear when you select "AC storage" ?
-----------
Another idea could be to leave the "load analysis" graph visible when "ac storage" is selected.
Then we would see the power curve of CT2 in the main graph, we would see the current deviation in the synopsys and we could see the load distribution of the "battery" in the new graph you just created! This is perhaps easier to realize, no ?
thank you for your feedback
Thanks again for your involvement, I will already show what you have changed to my forum friends who also have routers ....
Hello,
I looked again today!.
It would be great to be able to see the energy transfer to the special load or ac storage ( it depends on the choice of assignment of the CT ( ac storage or load ) in the synoptic
Tanks 😉

Hi,
We have updated the function.
You need to set the phase to 'Load', then you can see the change.😀
Thanks a lot.
I'll have to wait a few days for the sun to come back out to do the tests but it looks like a good start!
I'll still propose some translation corrections : https://imeter.club/topic/357
😀