Hi,
On a first page in my Android aplication I see power of only first phase (a), in details of every meters everythink is ok.
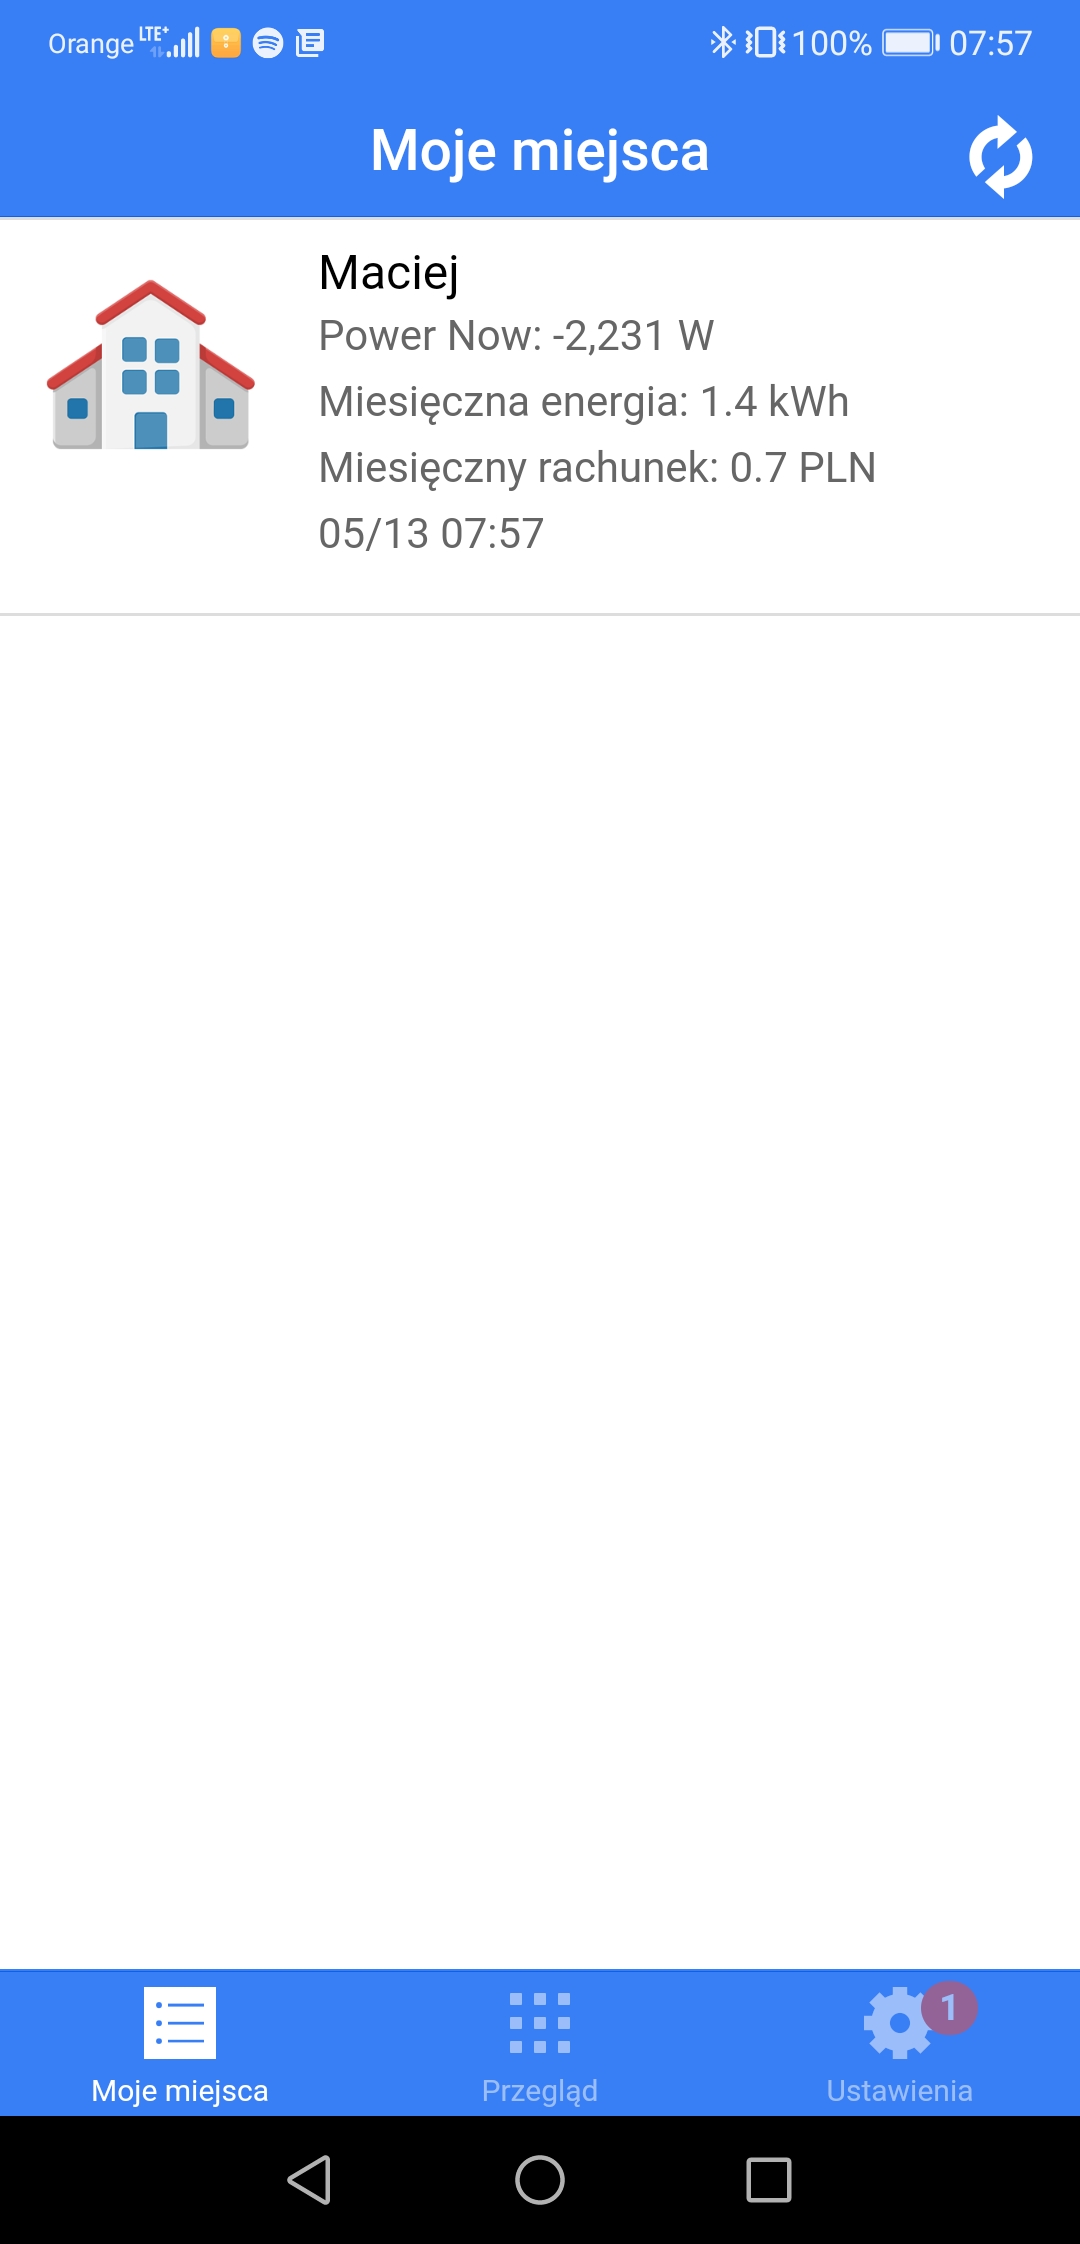
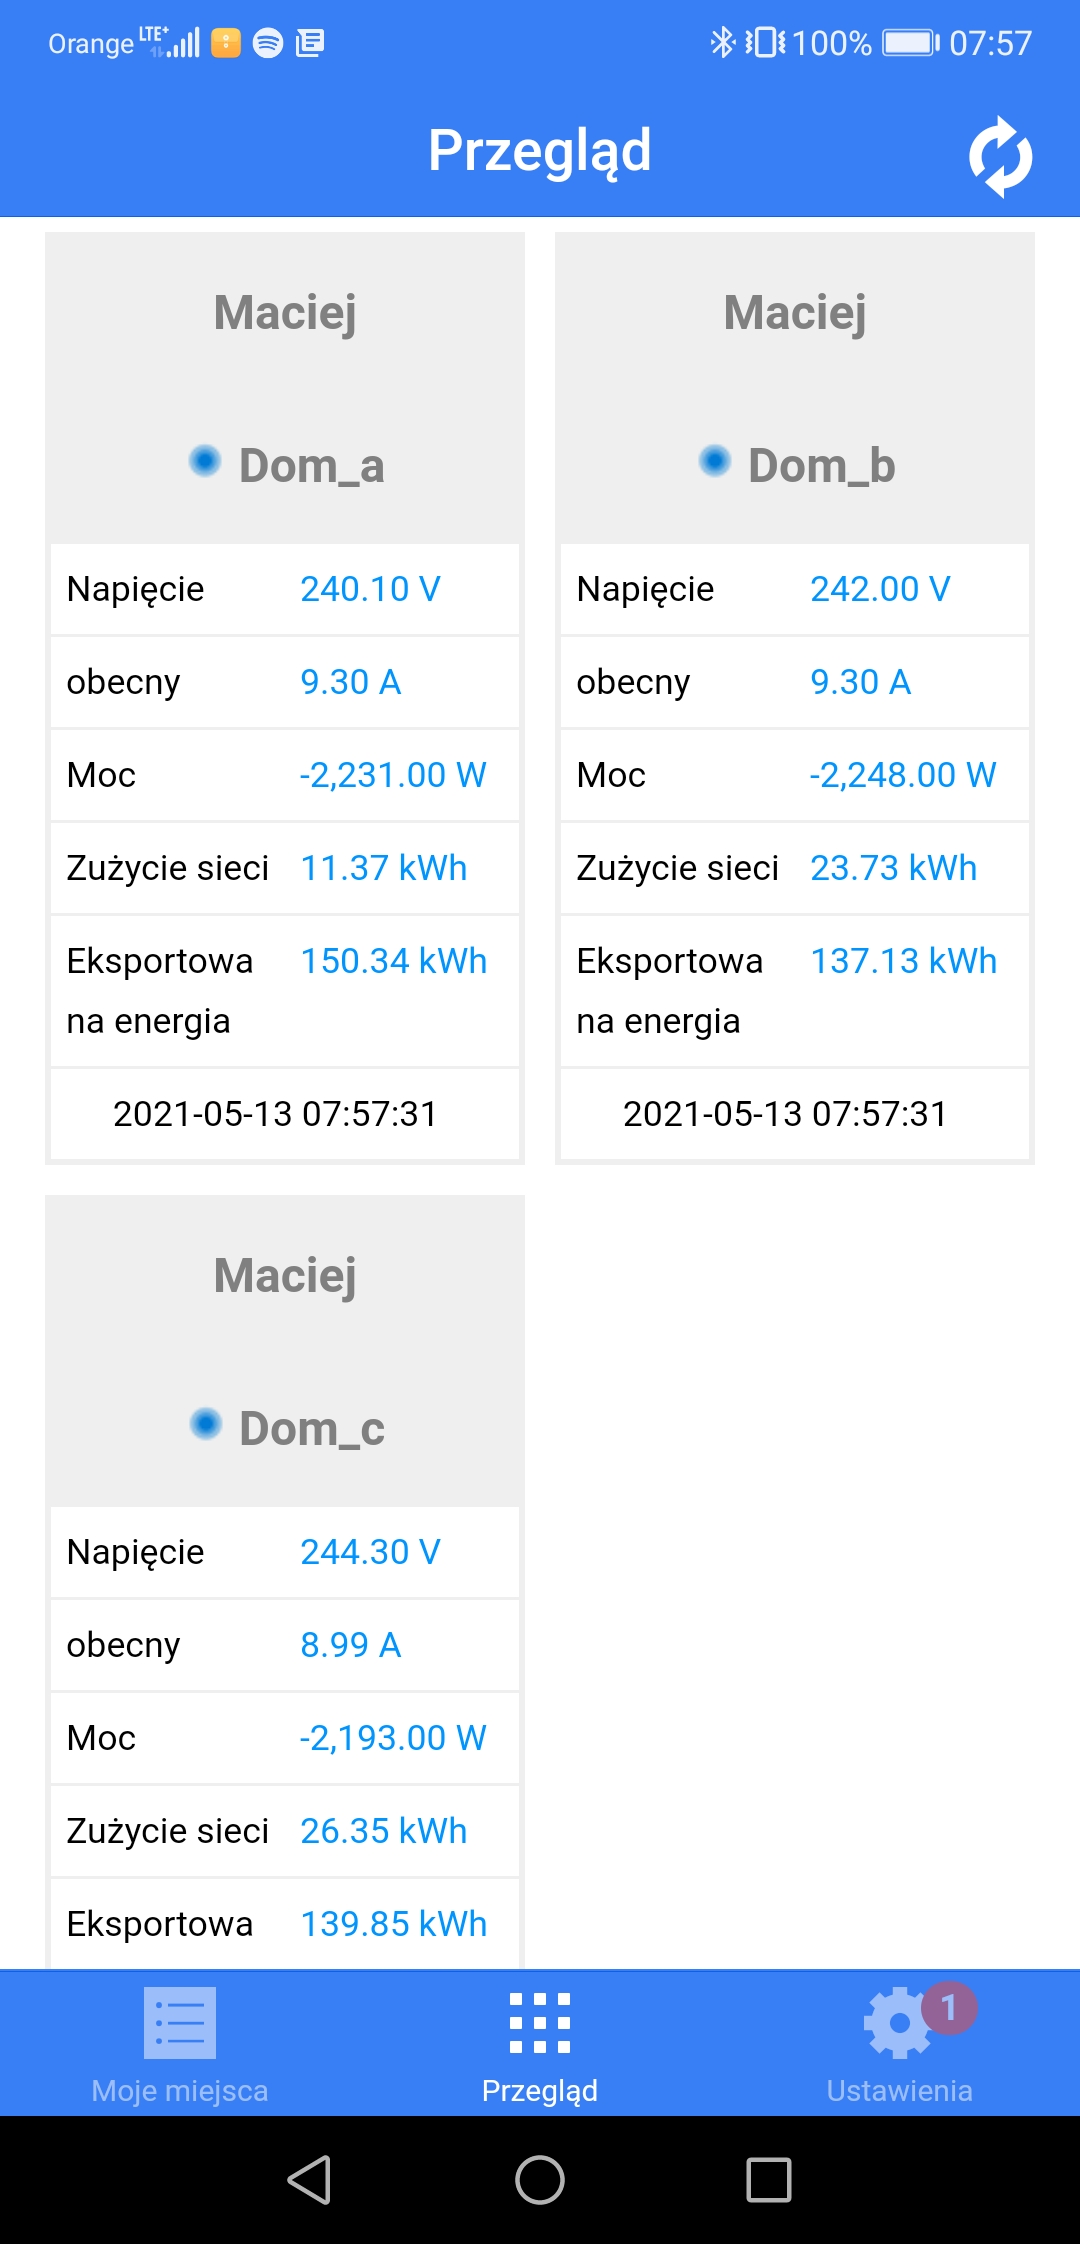

We have fixed it, Thanks for your feedback. 😀
i have a PV on Phase 3 (c) the rest i have no PV it is wrong ?

Hi,
I think your data is right.
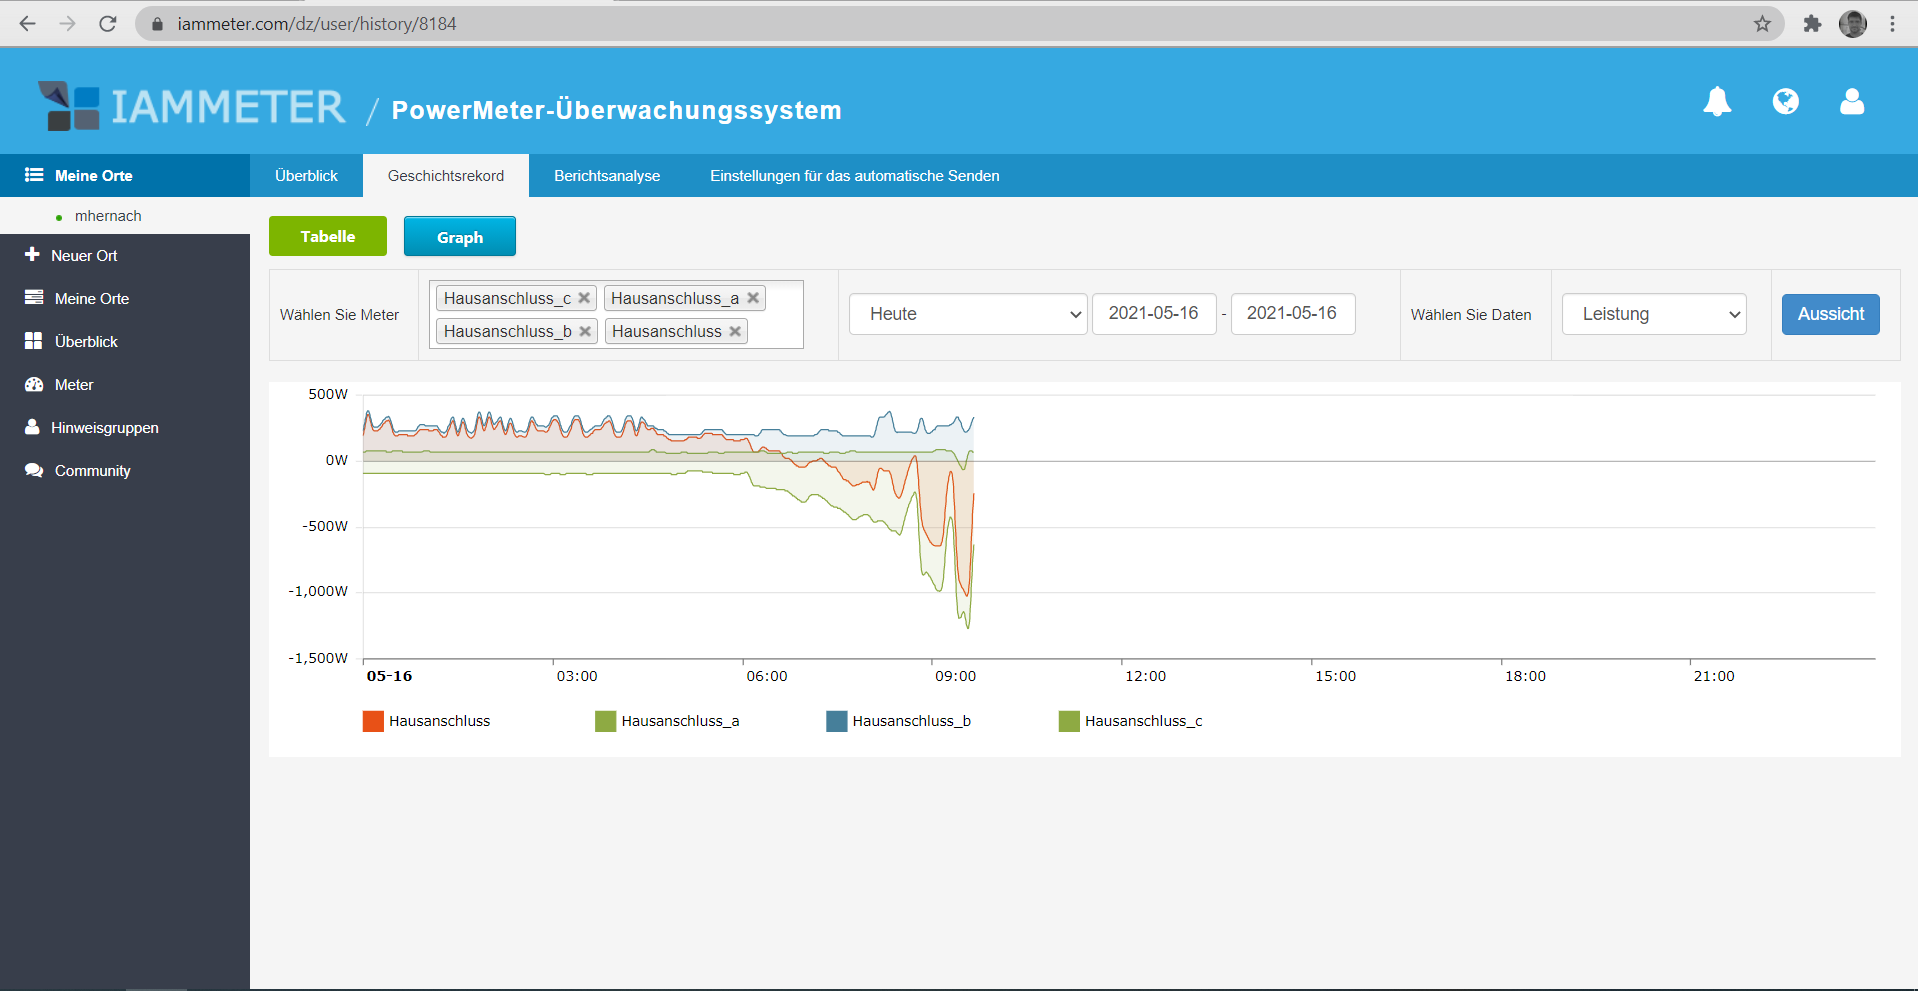
You can still analyze the data in this view
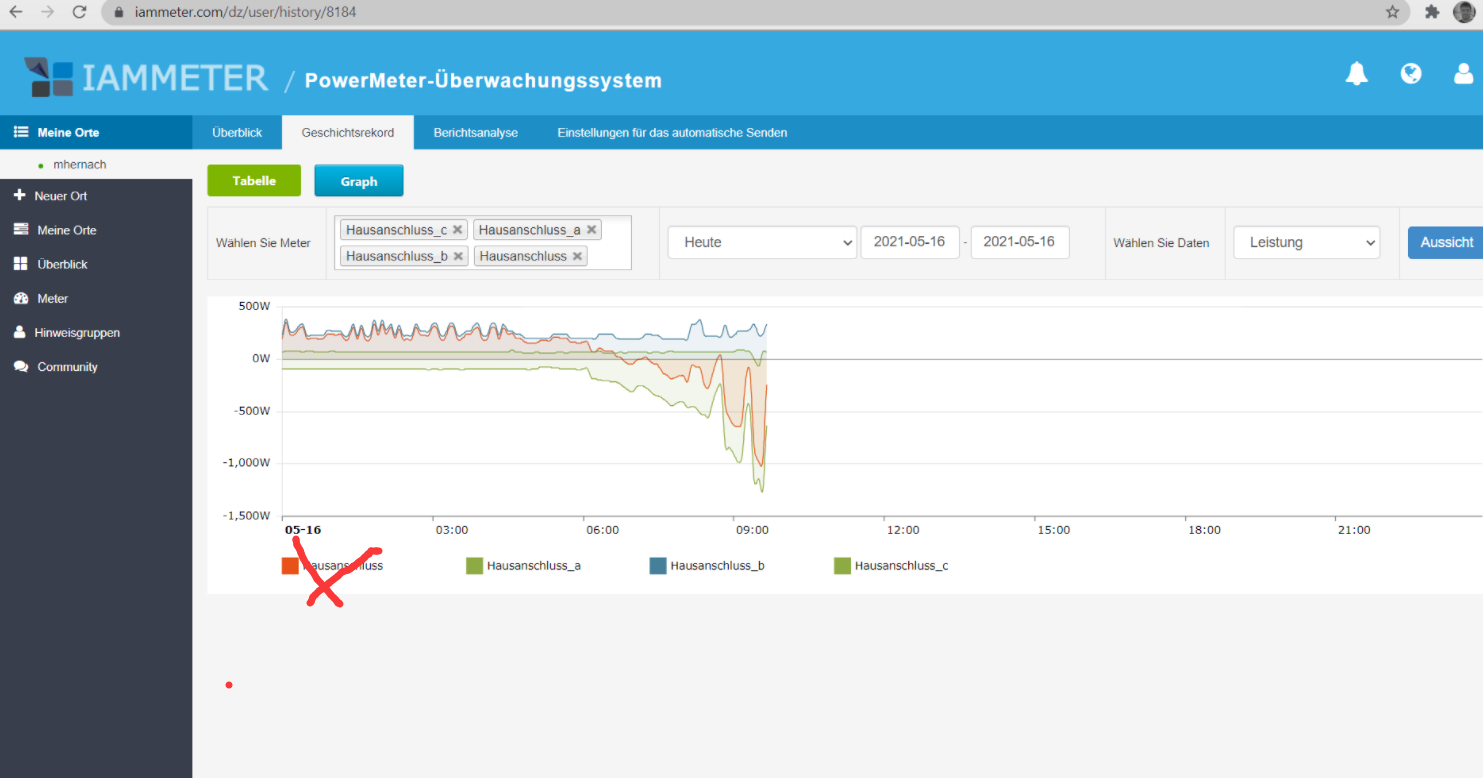
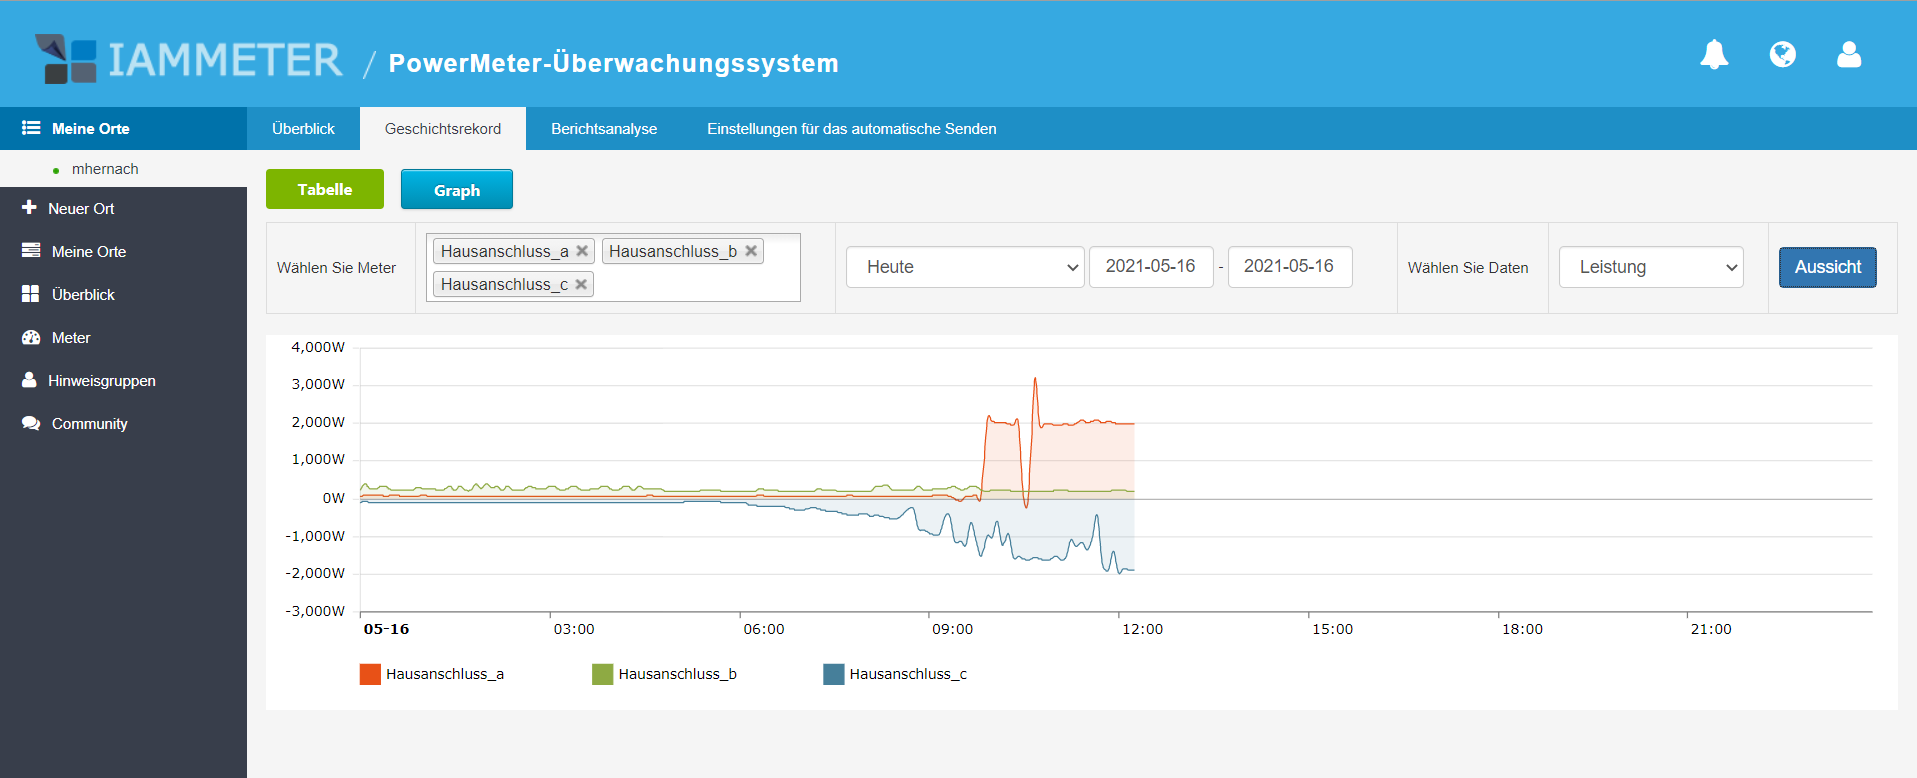
But please note, do not select the total option, just left the phase A, phase B and phase C, then it will be more clear.
You will see the positive power of phase A and B (mean consume energy from grid), and negative power from phase C (mean export energy to grid)during day time.
Thanks for your answer.
I only have one more question.
my PV system now brings around 4.5 kWh and the display is just 2kWh in the app here !?
how does this measurement tolerance come about?
if i switch to apparent power, i can see the correct PV power!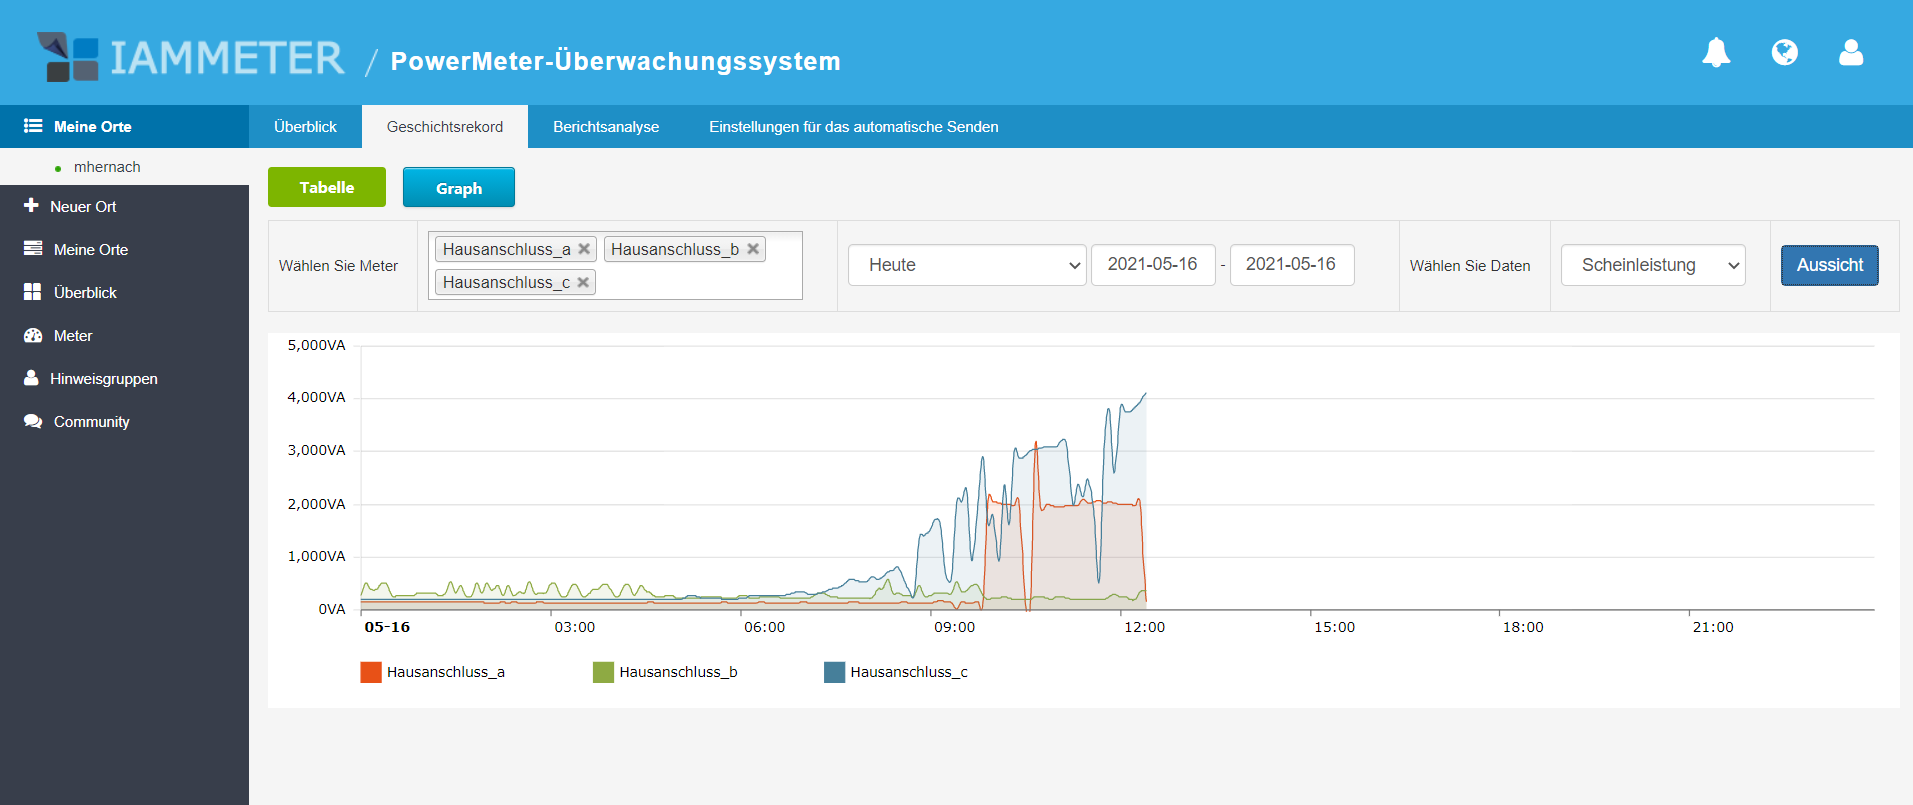
Hi,
Sorry, the description of my previous post is not accurate.
In fact, the active power of each phase is "grid power" (substract solar generation power from load power)
The meter is installed in "grid" side. So it can only measure the energy and power of "from grid" or "to grid", can not measure the solar PV power and energy .
Because there is no solar generation in phase B and A , so the grid power B and A is just the load power of phase B and A.
But there is solar pv power in phase C ,the power C display is not the solar pv power ,but the solar pv power subtract the load power of phase C.
(if your peak solar power is 4.5kw, but it show only 2kw at noon, it mean that it has a load consumption about 2kw at phase C at that time.)
if there is no load power in phase C ,the power C would be same as the solar generation power.
Hello, now I have bought and installed a 1 phase in addition, this is installed on the phase of the inverter. and also this does not show me the right performance!?
I do around 4.7-4.9 kWh at lunchtime...
Hi, please give us two snapshots in this page
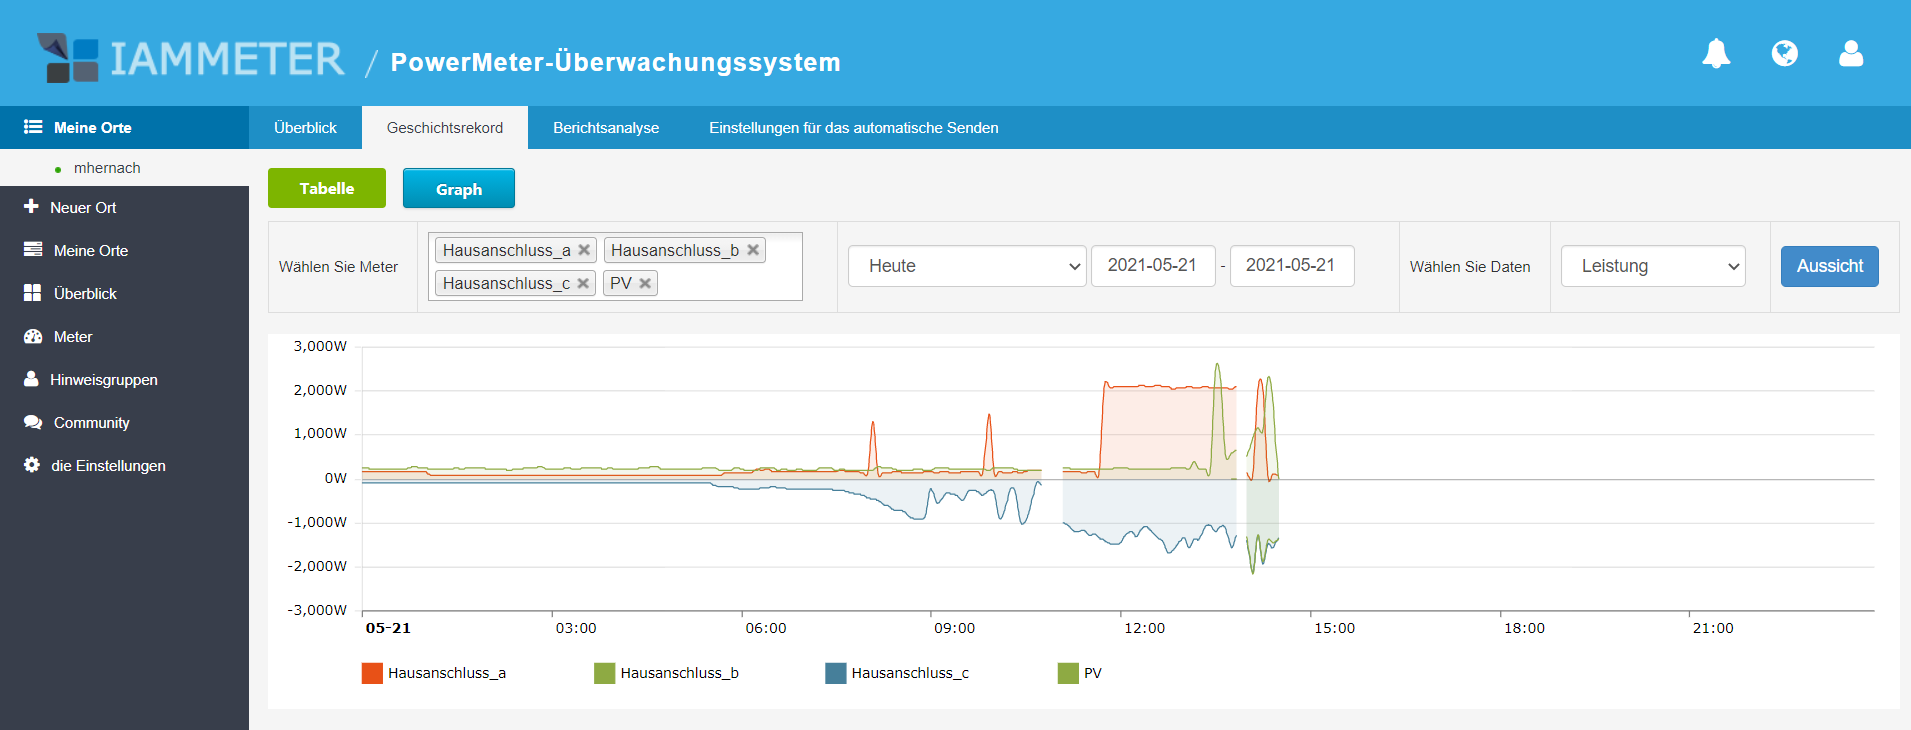
1 active power compare(PV and phase C of WEM3080T)
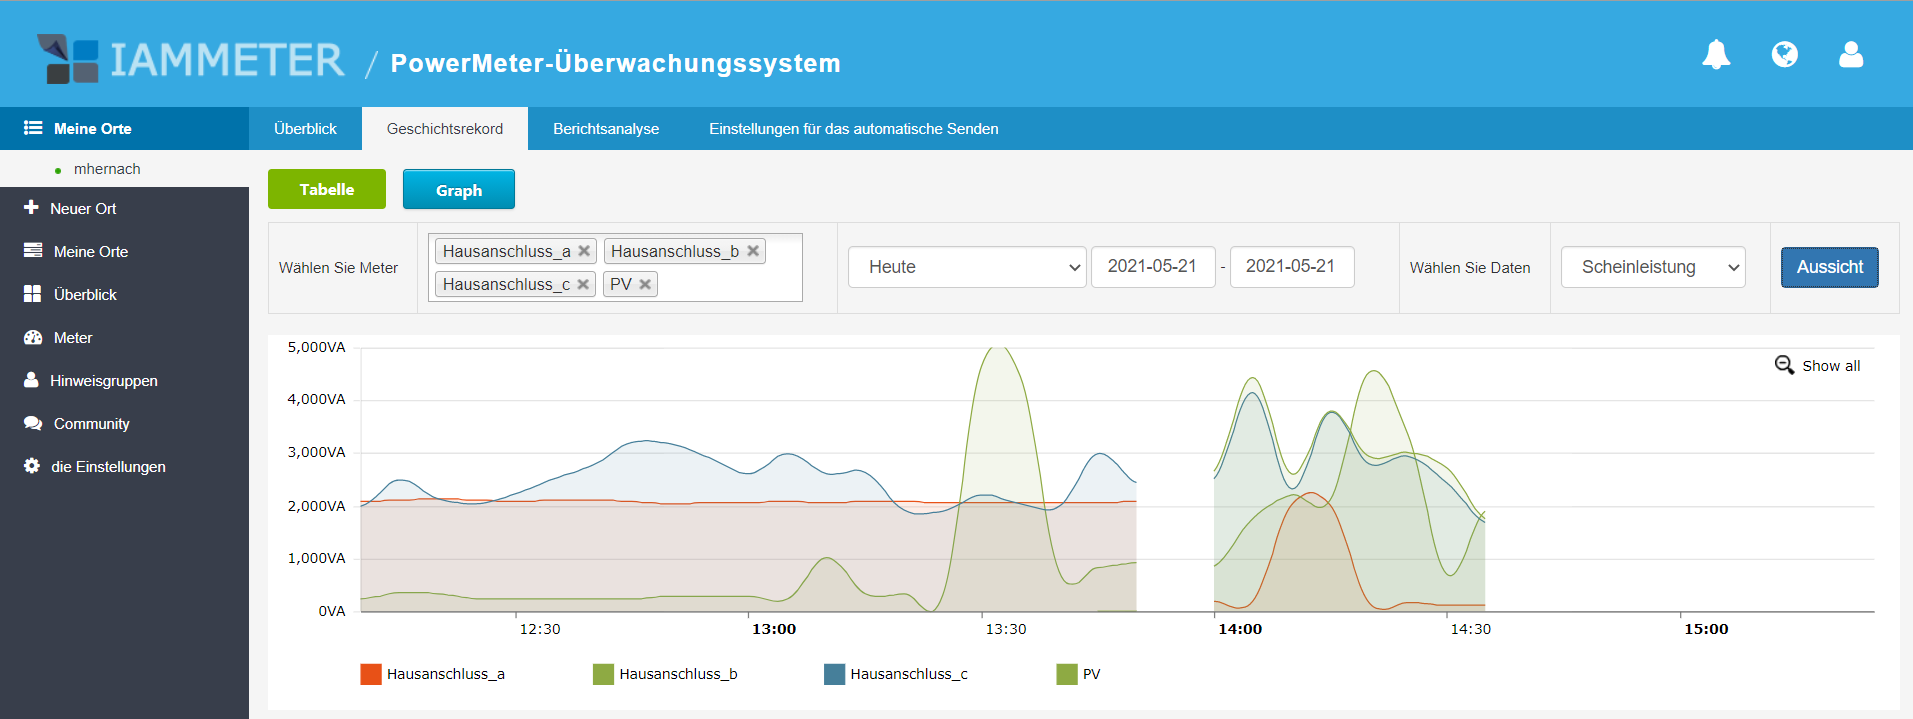
2 apparent power compare(PV and phase C of WEM3080T)
please help me confirm this issue.
1 only phase C have solar PV utity, yes?
2 you have only one inverter and you had installed the WEM3080(name it PV in the meter) to monitor it ,yes?
Hi Michael Hernach:
If possible, please issue a new post and answer my question in the new post.
This post here was only about the problem in app display (we just use one of the phase data to display in that page before, now we have upgrade our app to display the sum data,Strictly speakingi, this is a optimization ,not bugfix. ).
Your problem is about the energy meter usage in solar PV monitoring application.
Let us communicate in new post , it will be more clear about what this problem is and how to solve it finally.
This is my question (same as previous post)
1 active power compare(PV and phase C of WEM3080T)
2 apparent power compare(PV and phase C of WEM3080T)
please help me confirm this issue.
1 only phase C have solar PV utility, yes?
2 you have only one inverter and you had installed the WEM3080(name it PV in the meter) to monitor it ,yes?
Please create a new post and reply them there . Thanks