Demand charge power graph based on the time in a billing cycle
The maximum demand charge power of each hour in the billing cycle
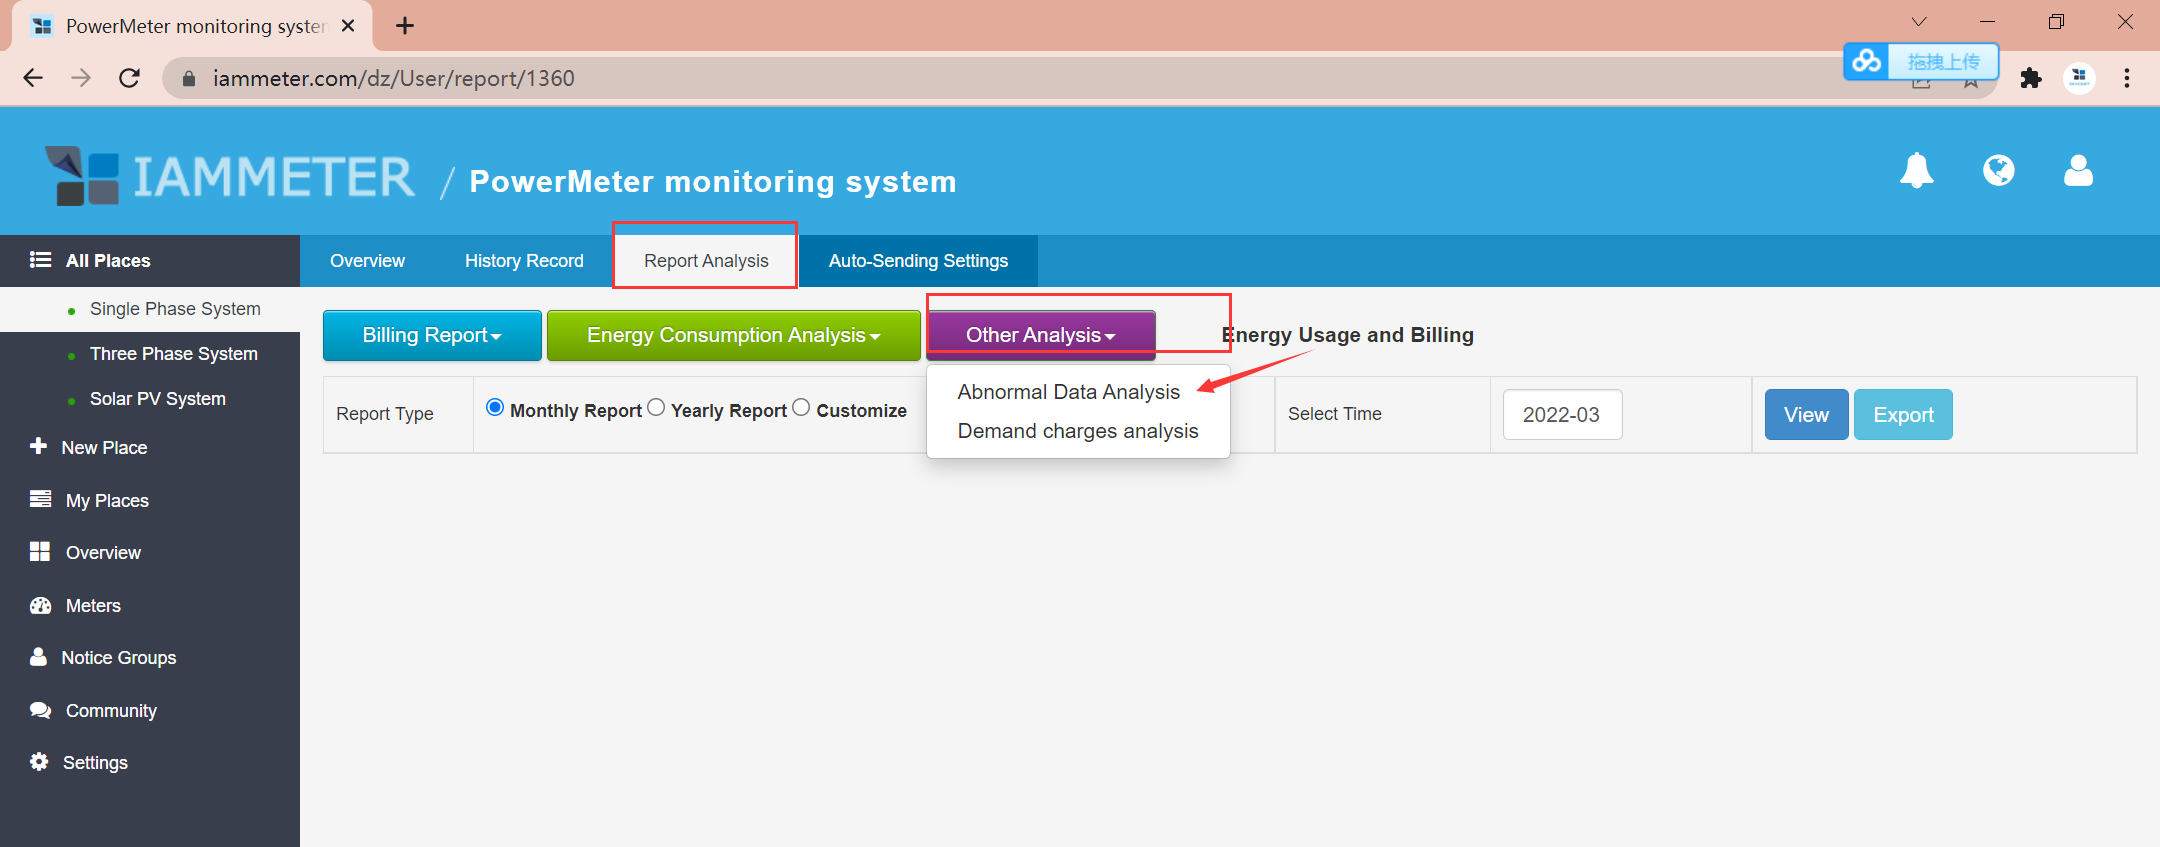
How do find this report
Place -> Report Analysis-> Demand charge analysis

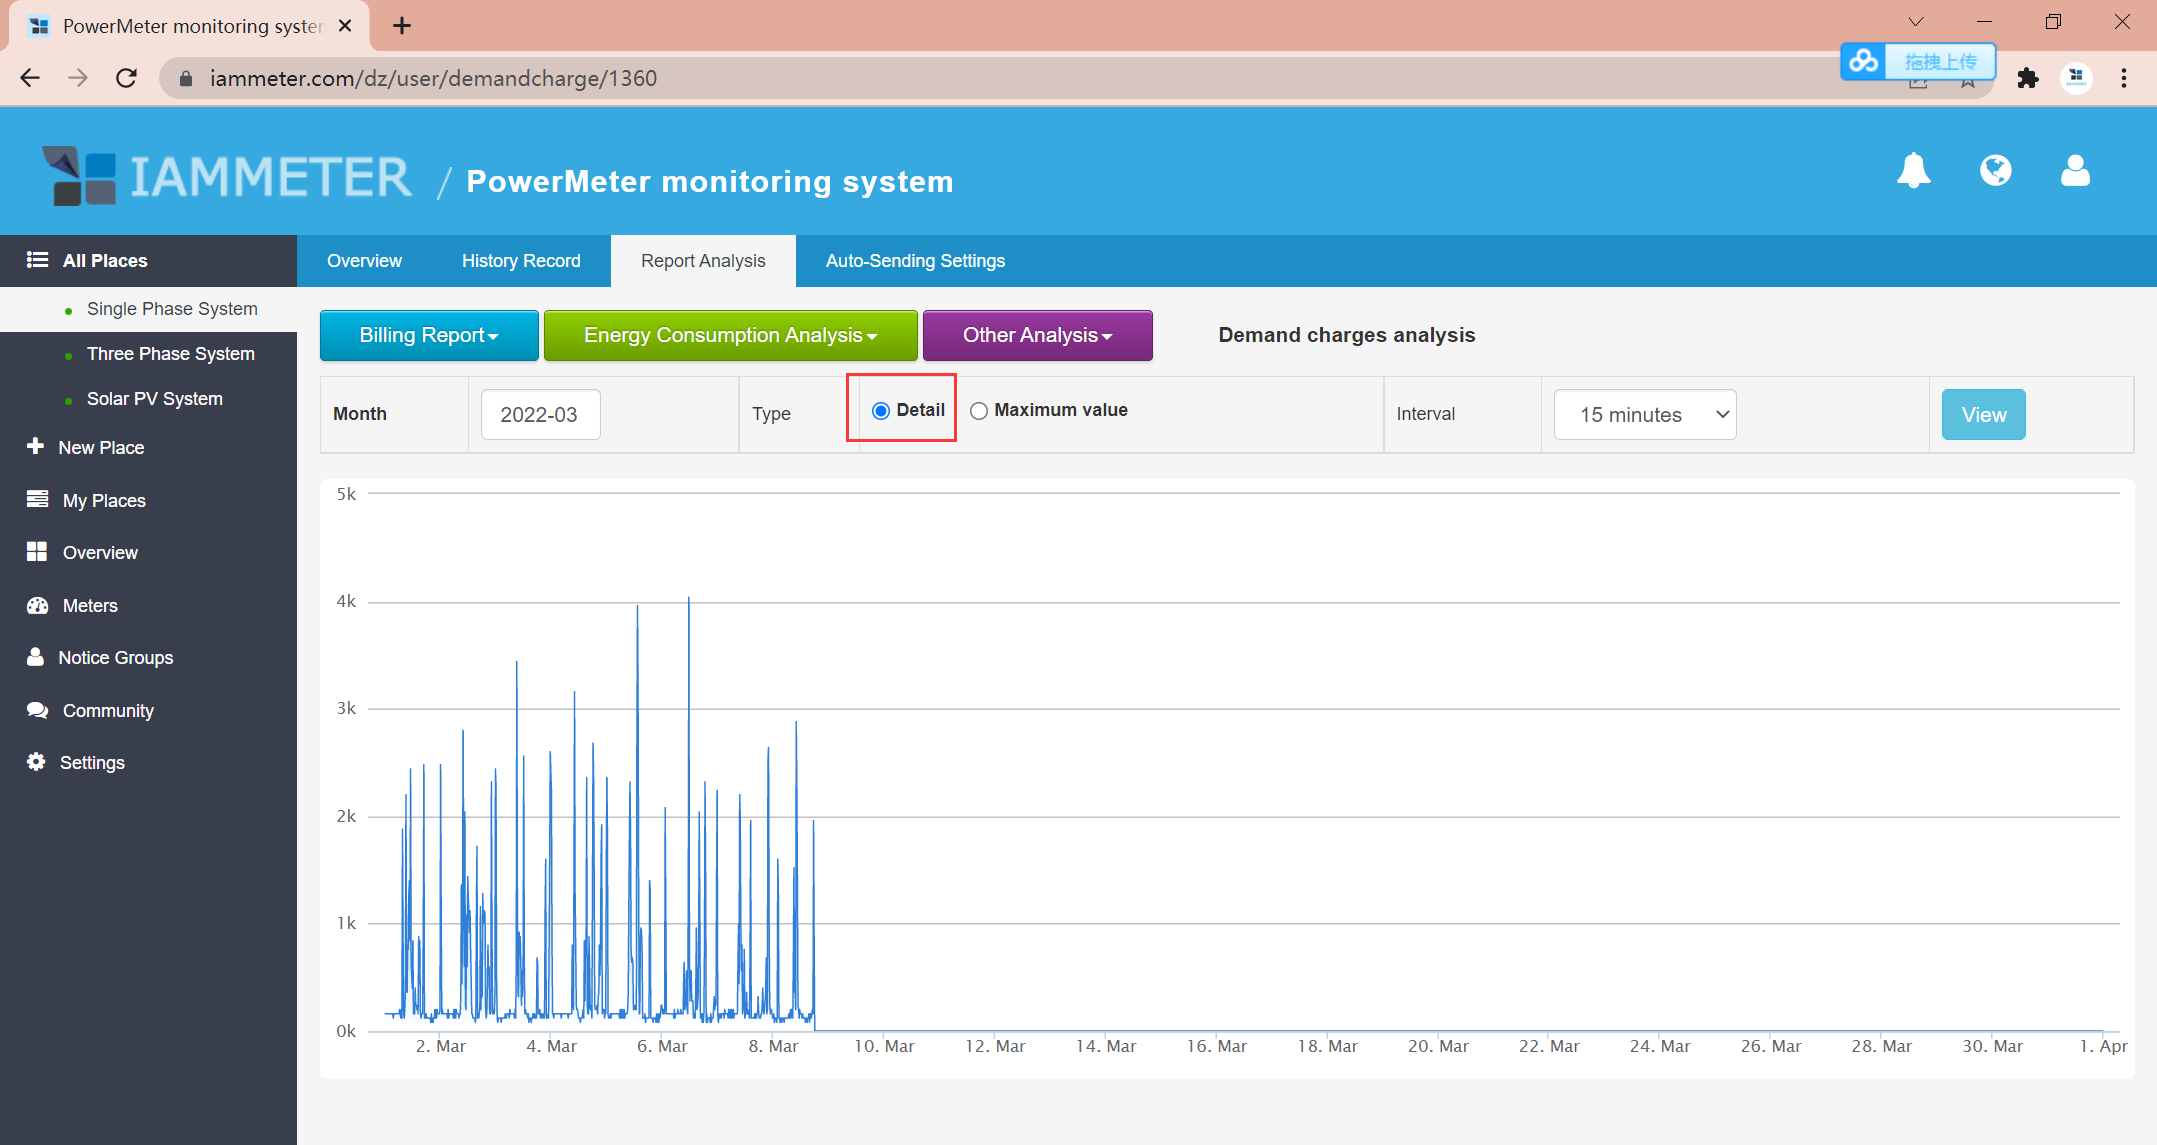
Demand charge power graph based on the time in a billing cycle.
IAMMETER will calculate the demand charge power (15min) in the whole billing cycle and display the result in the graph.
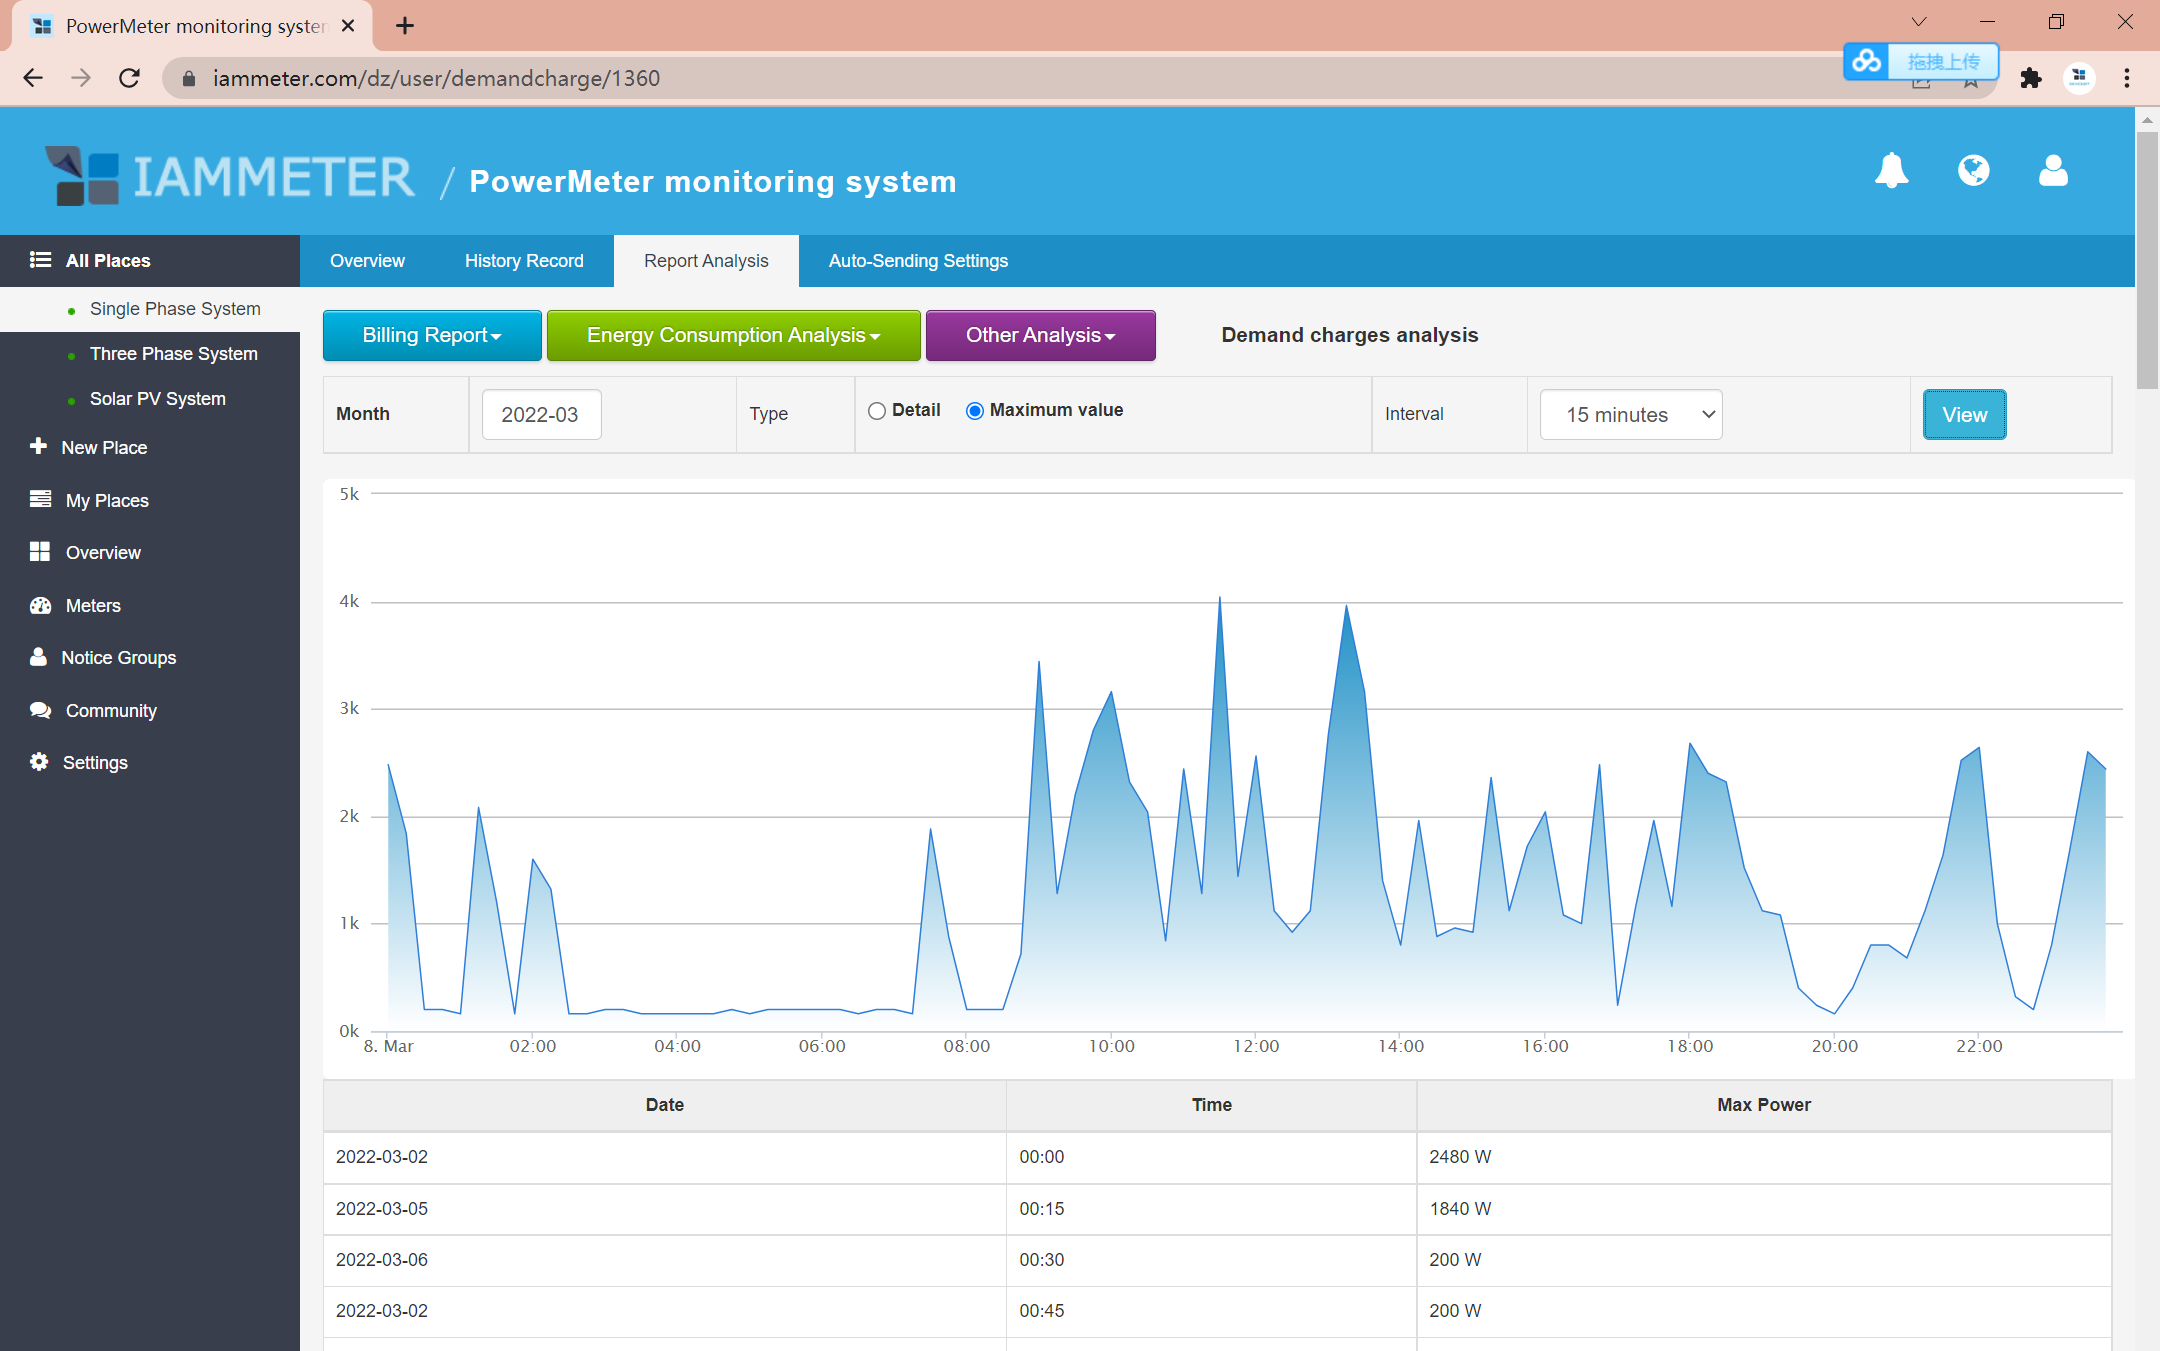
The maximum demand charge power of each hour in the billing cycle
This graph will help you find the maximum demand charge power of each hour in the whole billing cycle.

Good day,
I reside in Queensland, Australia, and I have the following electricity tariff structures:
a) Tariff 1: Principal energy consumption tariff - all day at a fixed rate (c/kWh)
b) Tariff 2: Controlled energy consumption tariff - all day at a fixed rate (c/kWh)
c) Tariff 3: Maximum demand tariff - charged as $/kW/month. These charges are applied to the maximum half hourly kW power recorded within a peak demand window.
d) Fixed charges: Metering service charges - charged as $/day, for each day of the monthly billing period.
Modelling Tariffs 1 and 2 can be done with the existing available Power Tariff templates, however a template for the Maximum Demand tariff does not seem to be available.
In addition, with Fixed "daily" charges being billed on a monthly cycle, 28, 29, 30, and 31 day charges are all possible (refer to item d). The current input on the Power Tariff template only accepts a monthly Fixed charge which does not accomodate the $/day charging method for the variable length of the months.
Can you please advise on the following:
1. Will a Maximum Demand tariff template be available soon?
2. Can the Fixed Charges input also be available as a daily charge, with the addition of the calculation of the monthly charge based on actual days/month?
Kind regards
Bruce Forsyth
Hi Bruce:
Could you please provide more details about the maximum demand charge tariff template?
- Does it apply to all 24 hours of the day, or only to specific hours (e.g., on-peak hours)?
- Is the maximum demand price consistent every day, or does it vary by day?
- Could you share an example of a real electricity bill that includes both a maximum demand charge and a daily fixed charge?
If we include the daily fixed charge and maximum demand charge as additional charges, listed on two separate rows (showing only the monthly total amount for each, rather than itemizing the charges for each day) in the electricity billing report, would that be acceptable to you?
Best Regards
Laoliu
I am also in Queensland, Energex
They are measured in 30 minute blocks and run from 4pm to 9pm
The demand charge is the same per day
My bill looks like the following

I have taken a look at the reports, the only thing that would be a huge plus is allowing the users to input start time and end time of the demand charging.

Hi Dan:
Thanks for your feedback. I need to confirm something more.
How does the value of 73.036 kW result?
Is this value obtained by summing all the maximum power values within the demand period (from 4 PM to 9 PM) across 31 days? If so, this would include 186 blocks (calculated as 31 days × 6 half-hour blocks per day).
Or is it determined by selecting the maximum power for each day during the demand period (i.e., identifying the highest power value within the 12 demand blocks for each day)? This method would include only 31 blocks (one maximum value per day).
2 How is the maximum power in each half-hour block calculated?
We understand there are two potential methods to calculate the maximum power:
Using the instantaneous uploaded power value.
Using the kWh difference over the half-hour period.
However, neither of these methods is likely to yield the exact maximum power. Therefore, I am curious about how the electricity supply company calculates the maximum power for each half-hour block. Could they be using another approach to determine the most accurate value?
