Please kindly share your suggestion about the WiFi energy meter of IAMMETER
In order to make our systems and products more powerful and interesting, we continue to do a survey.
1:How do you know IAMMETER products
2: In your opinion, what is the most attractive feature of our product and system?
3: What new features do you most want us to provide or upgrade?
Thank you for your constant attention and support to us! Wish you all the best!
Please view the existing suggestion first before you submit your idea.
If you find a suggestion that is the same as yours, you do not need to submit an issue with the same content.
What you need to do is just click "like" under the suggestion.
We will sort the quantity of "like", the suggestion with more "likes" will have more priority to put into our roadmap.
1. I own 4 WEM3080T and one WEM3080, all installed and using cloud monitoring. WEM3080T's are used in split phase installation. (North America)
2.Hardware is easy to adapt to different installations.
3. Would like to see a WEM3080(S) model that only has A & B inputs for use in North America split phase installs.
Thank You
Hi! I think would be helpfull to have an alarm for offline meters ;) I've noticed that the meter keeps the values for grid consumption, exported energy, etc. But I think it's only the sum because the system do not plot the graphs when internet is back.
Hello,
Please implement an option (under History Record-Graph) to view an all-time graph. At present, the maximum time is one year. It would be great to choose in the pulldown menu between Today/Last Week/Last Month/Last Year and All Time.
Thank you!
They should be implementing the MQTT protocol correctly. I used to use it through cloud however switched to having the unit talk locally to an MQTT broker. It needs to implement:
1. Some form of user configurable authentication, and SSL as a minimum.
2. Last Will (LWT) so that you know the unit is either online or offline easily.
3. And my personal favourite, the ability to reset all meter data, there are a lot of usage cases for this however the devs refuse to implement this feature under the excuse that someone may accidentally delete their data. (I would say that is the users total responsibility)
Hello
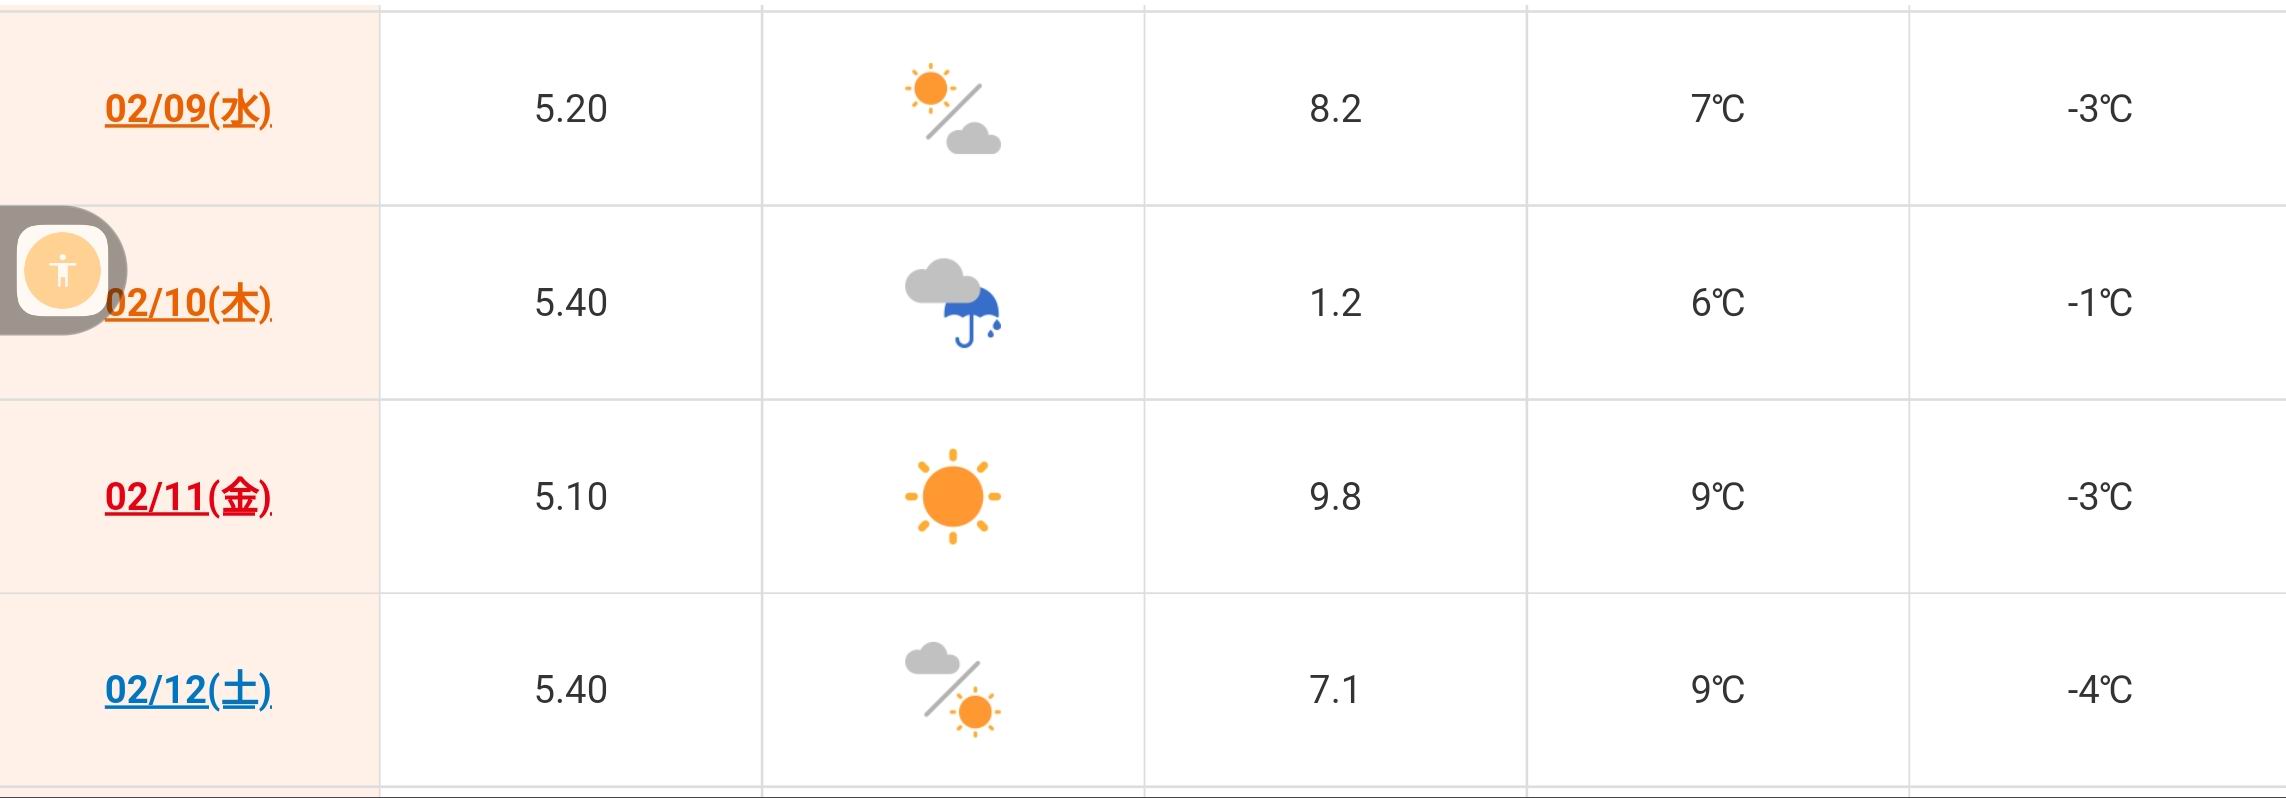
My local power company the following web services.
Is it possible to implement it?
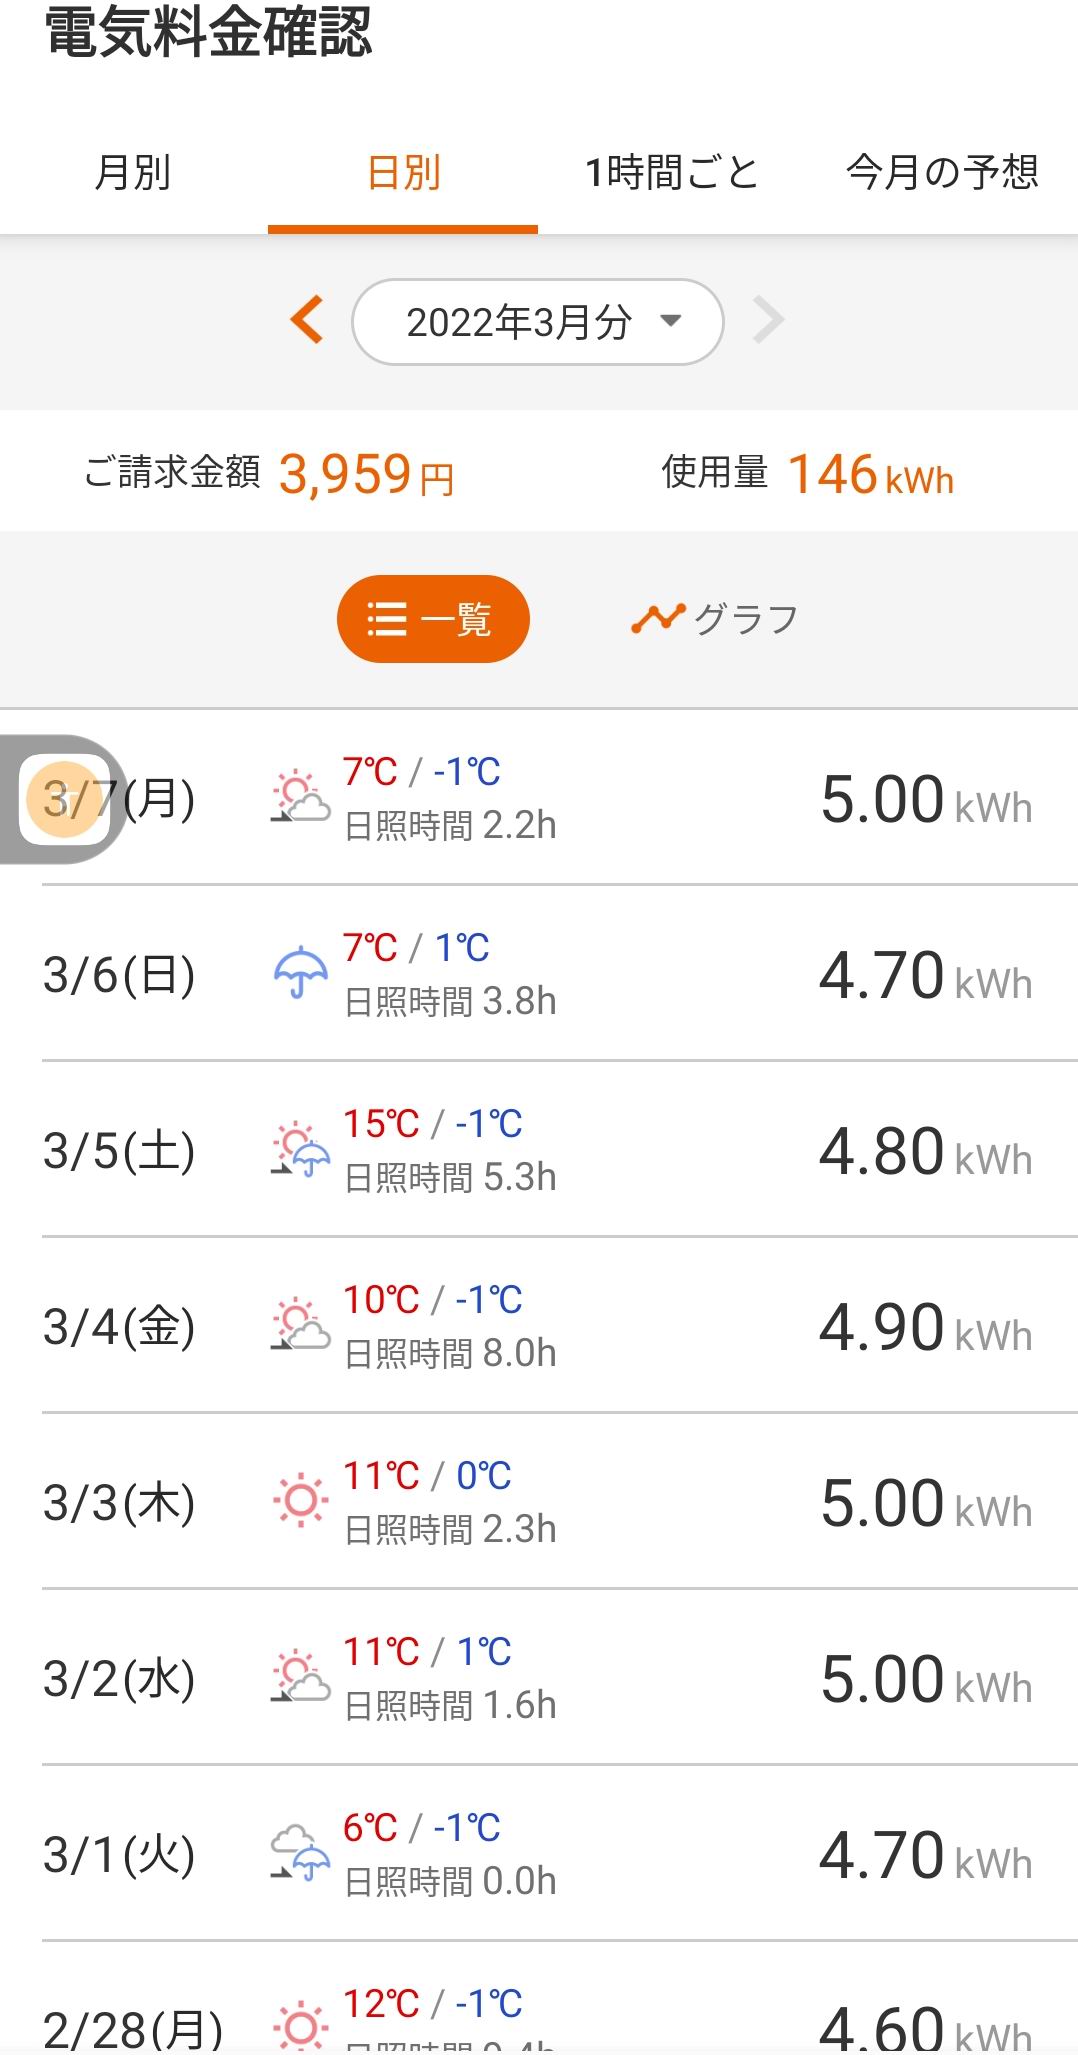
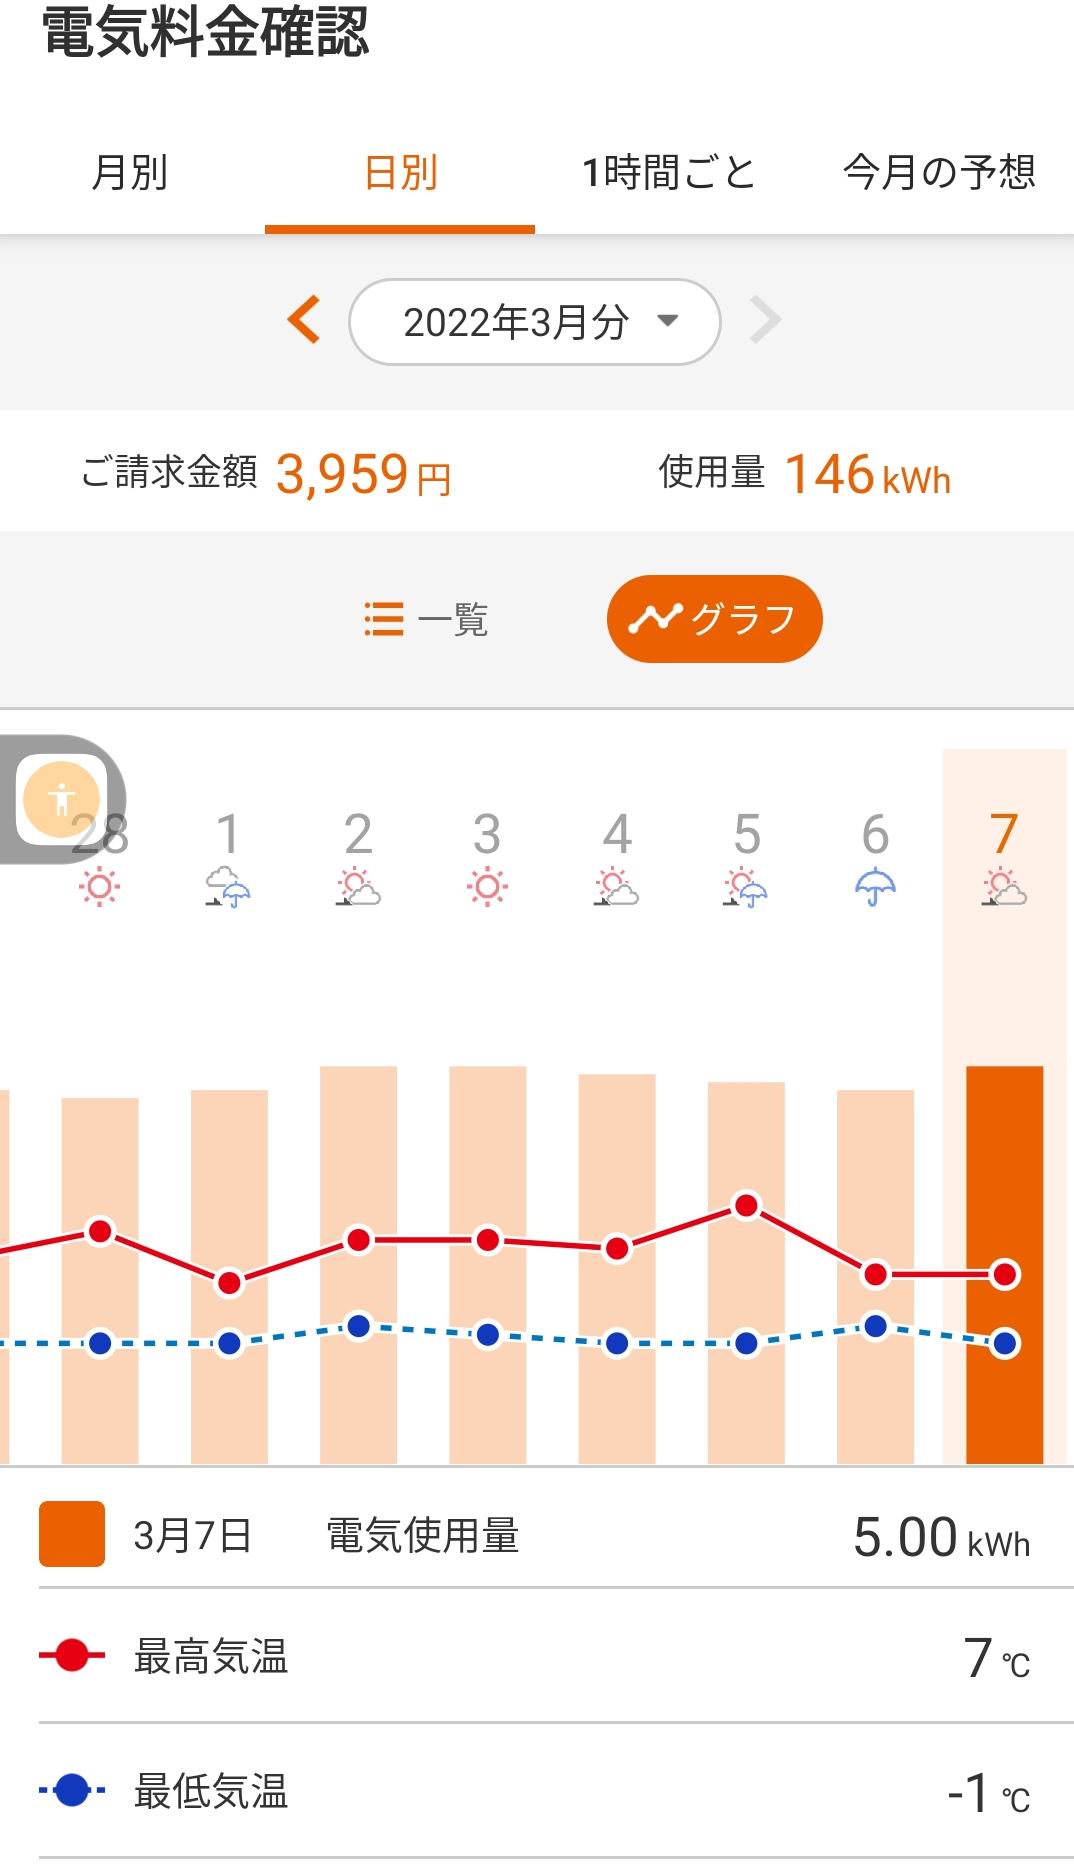
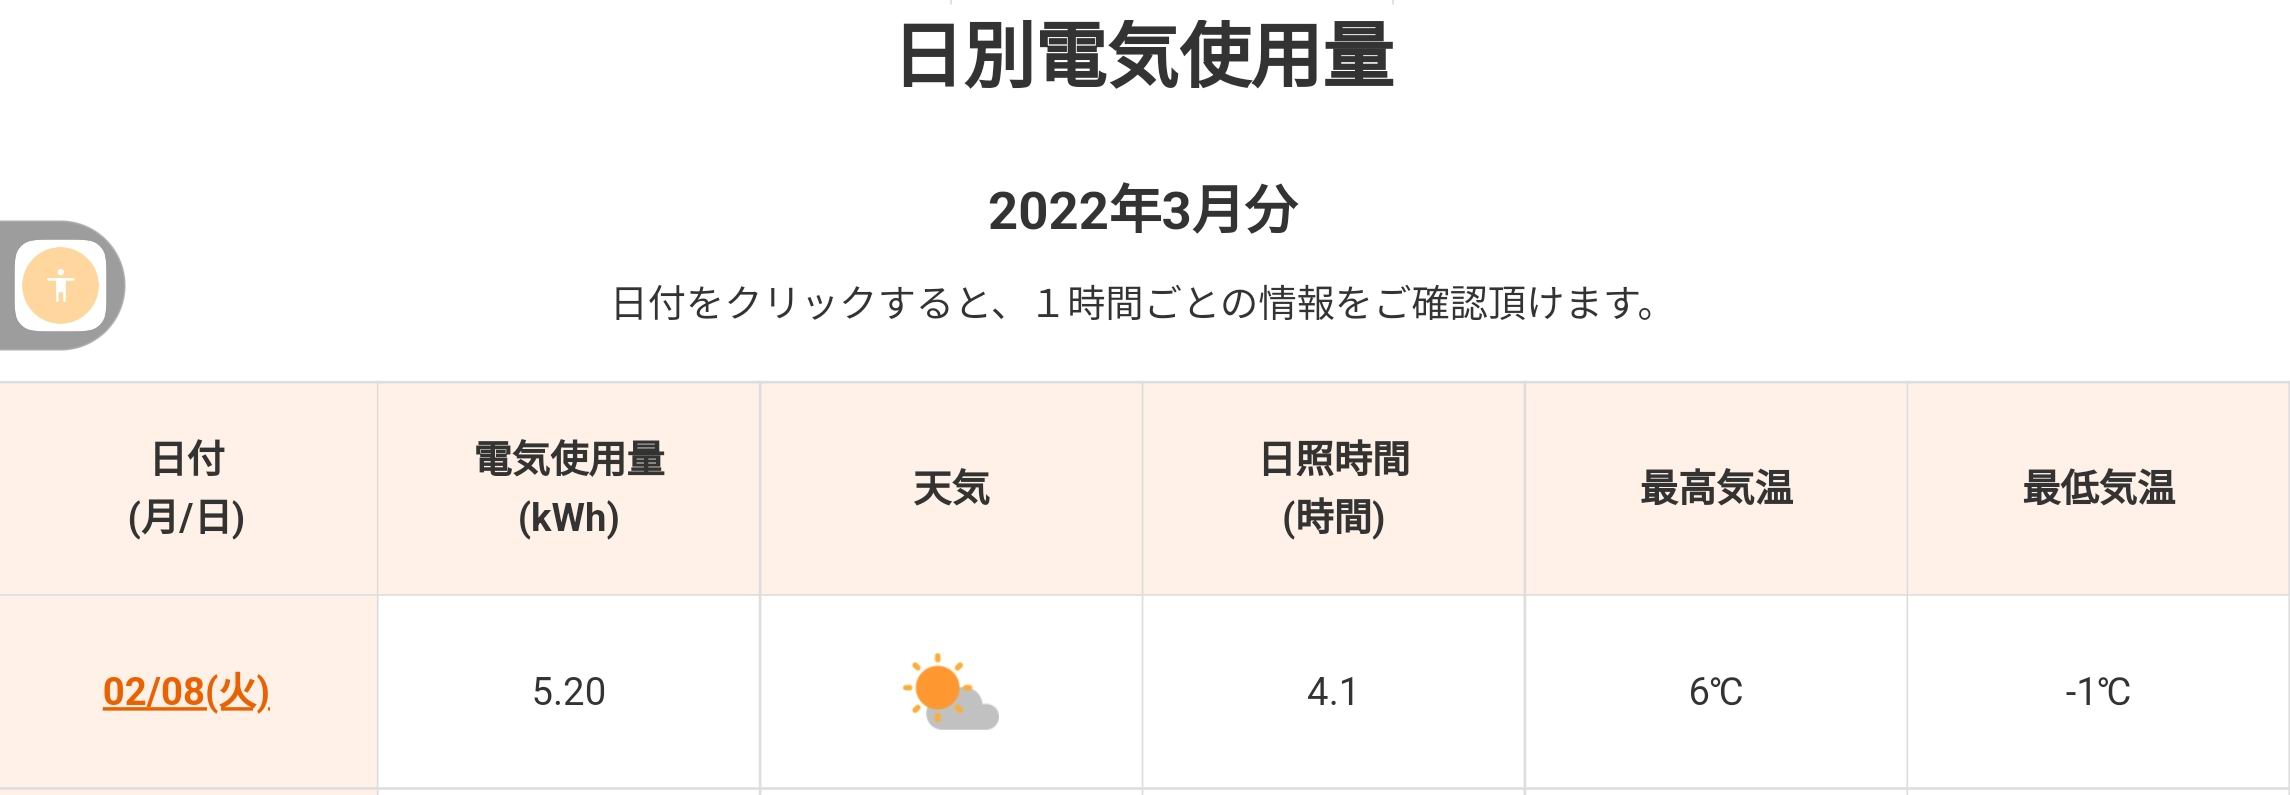
If realized, it will be possible to see the correlation between electricity usage and temperature and weather factors.
Display of daily power consumption
1. List: The maximum and minimum temperature and sunshine duration values and weather are listed in the daily power consumption values.
2. Graph: A line graph of the minimum and maximum temperatures is superimposed on the bar graph of the amount of electricity used by day.
3. Matrix: In addition to the daily power consumption values, the values of weather, sunshine hours, maximum temperature, and minimum temperature are added.
Hi,
it is indeed an interesting feature.
In fact, this feature is not difficult if we can find a proper API service that can return enough weather information.
If anyone knows of such an API service, please let me know here.
Hello
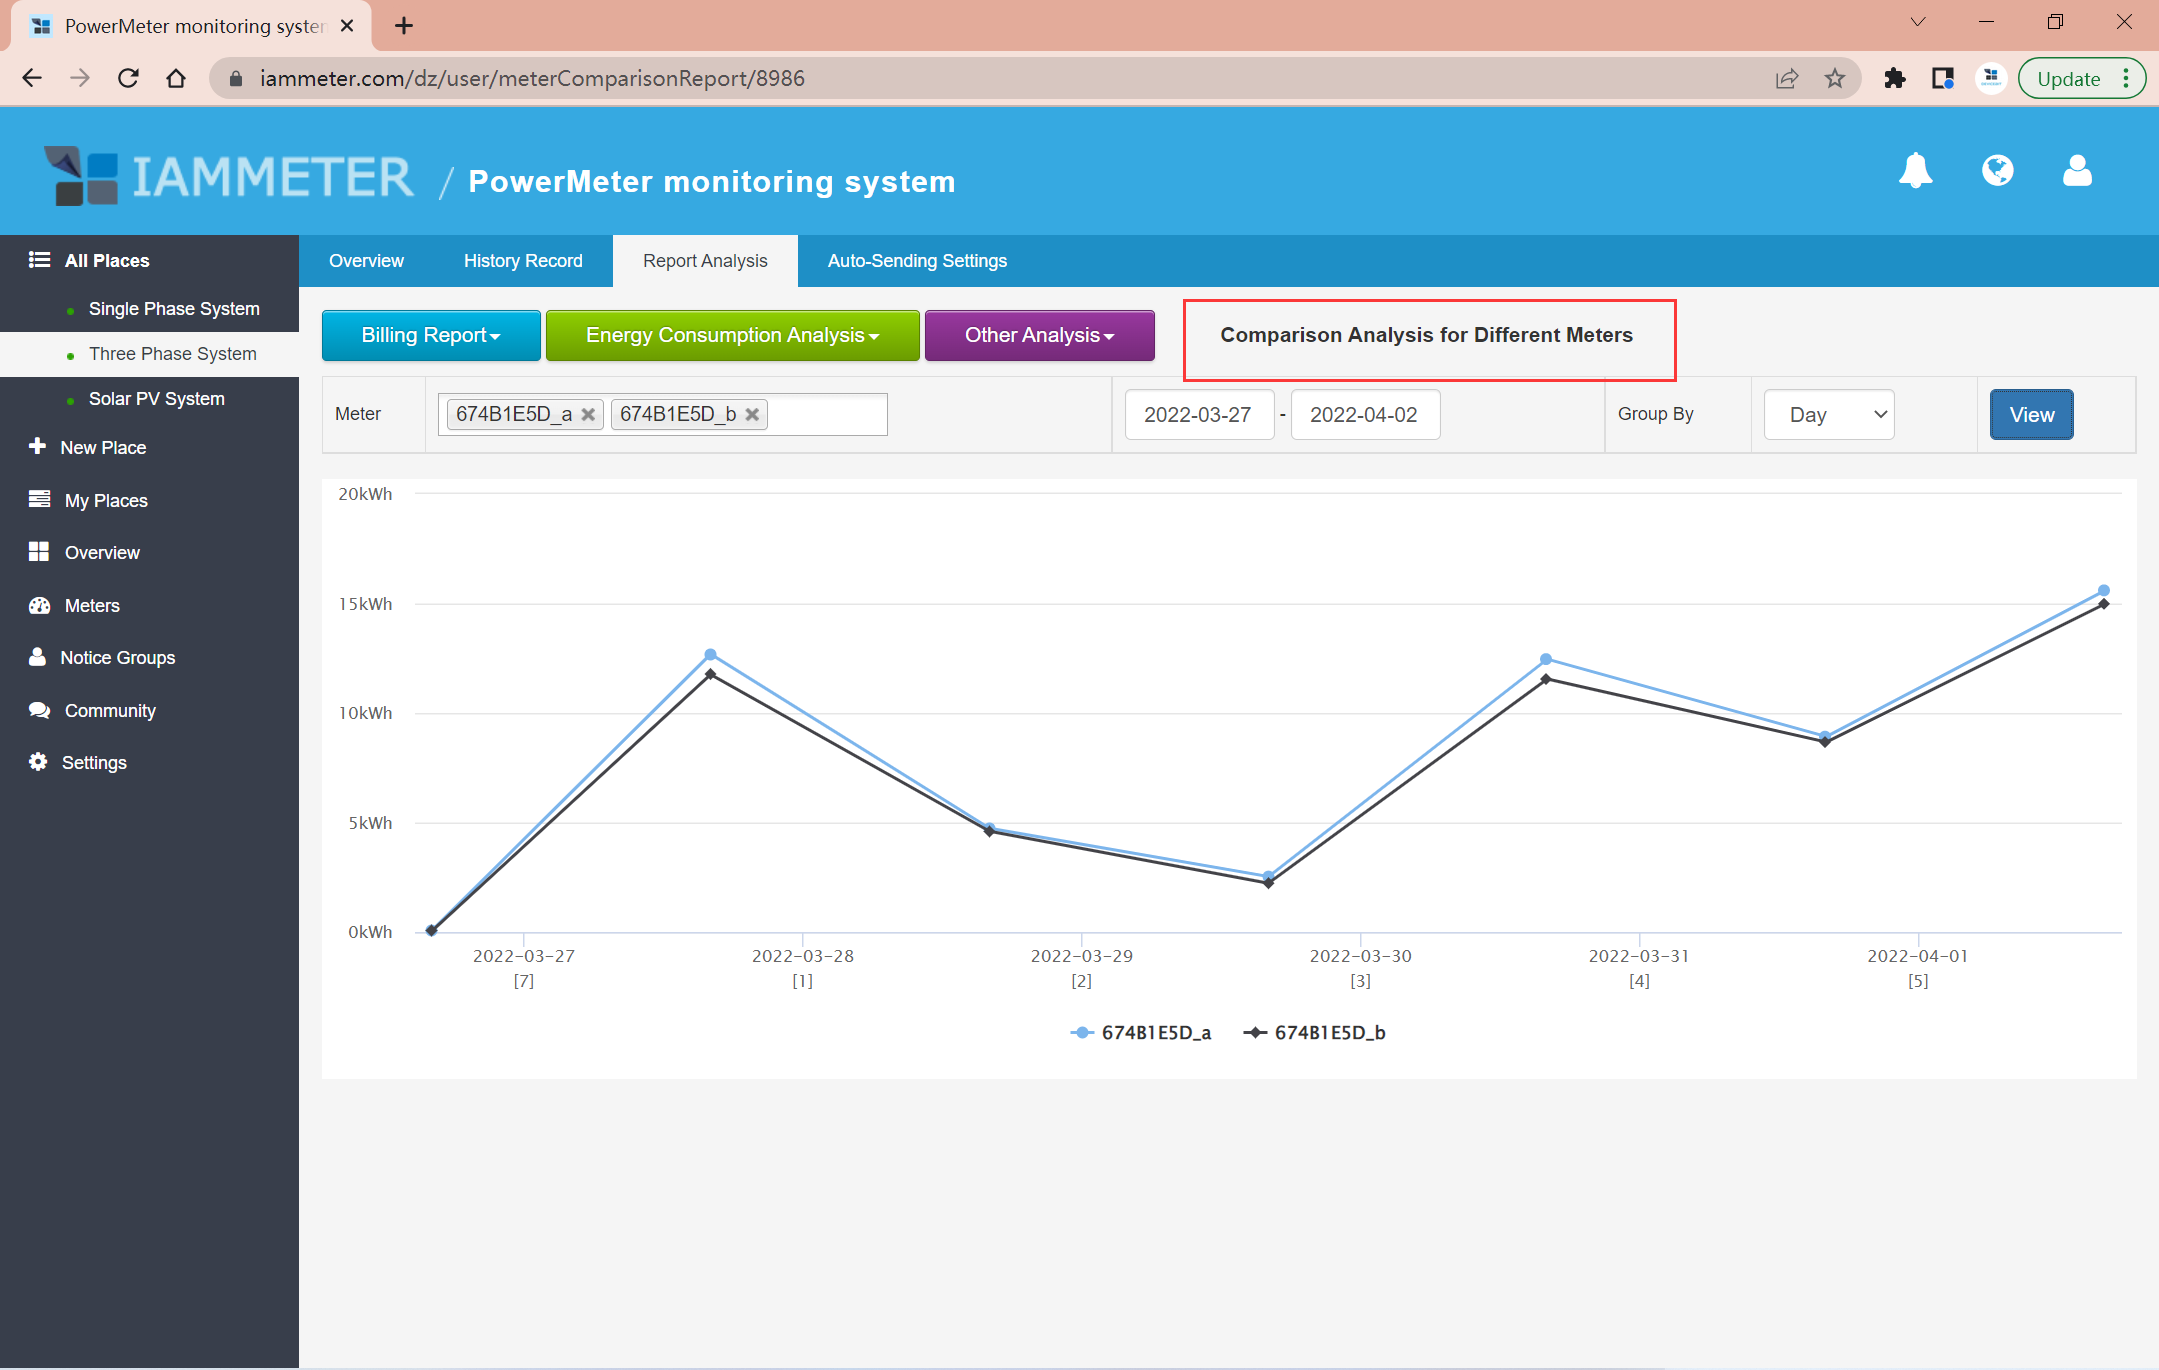
Is it possible to add the day of the week to the part shown in the screenshot below?
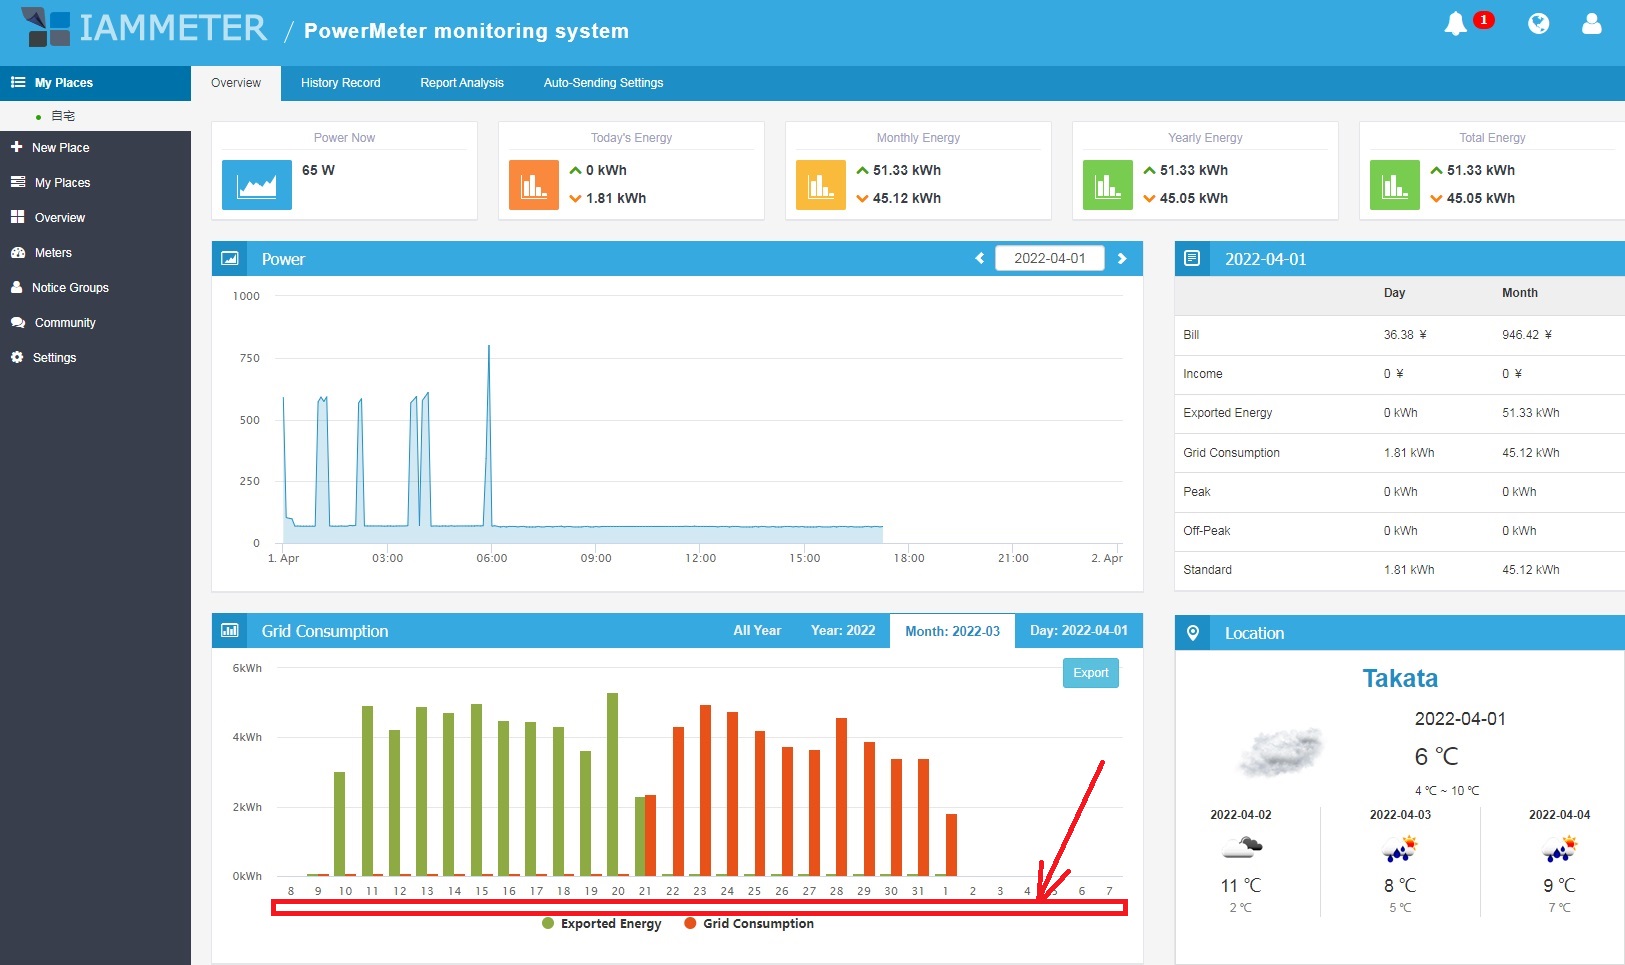
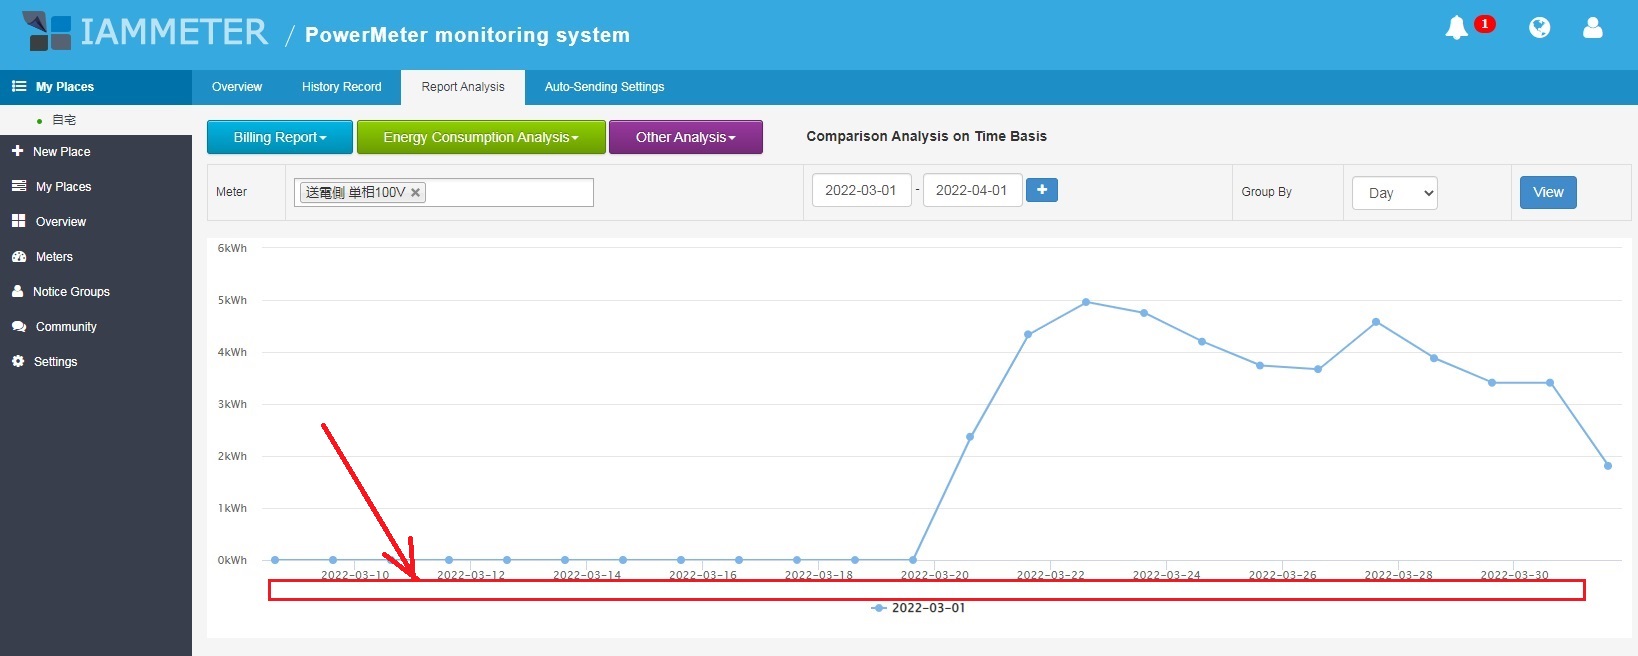
Thanks we will upgrade our system to support this feature recently.
Done.
Hello
Thank you.
Is it possible to display the day of the week all items that display the date of all pages.
Moreover, could you change the day of the week as follows instead of the number?
Sun, Mon, Tue, Wed, Thu, Fri, Sat
Hi,
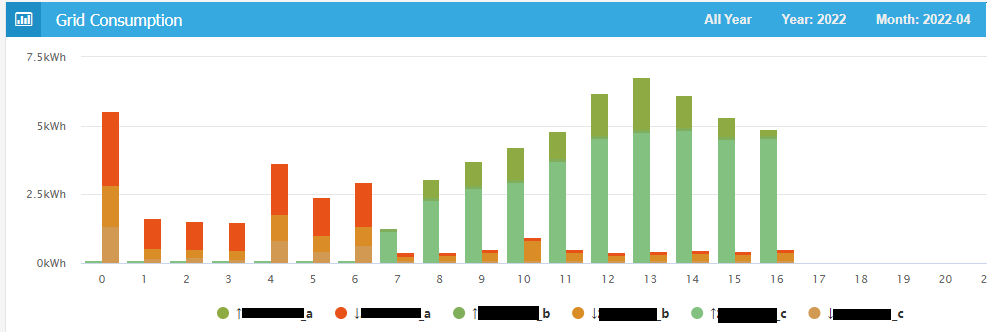
I would like the possibility to see a netto in&out for a three phase system.
On two of my three phases (a and c), I have PV-panels. This means that at certain times of day, I am exporting energy on those two phases, but the third phase (b) will always have grid consumption.
Your grid consumption graph shows per phase the export & import of energy, but I would also like to have to possibility to "add" both in&out of all three phases together so that I also can get a graph and data of the "netto" energyflow of the total system, not only of the separate phases.
PS: it is also strange that your graph shows a little bar of energy consumption on my a-phase during the hours I also have major energy export on that phase. One would expect to see only the consumption bar of the p-phase?
Thx!
Hi,
Our IAMMETER system and the energy meter have already supported net energy metering mode.
Please refer to https://www.iammeter.com/docs/net-energy-meter
This link will tell you how to turn on the net metering mode in the energy meter and system.
PS: it is also strange that your graph shows a little bar of energy consumption on my a-phase during the hours I also have major energy export on that phase. One would expect to see only the consumption bar of the p-phase?
This phenomenon is also because you had not set the "net energy metering mode".
In your current setting("normal mode",not the "net metering mode"), the phase that do not have solar PV utility will produce the energy consumption during the daytime.
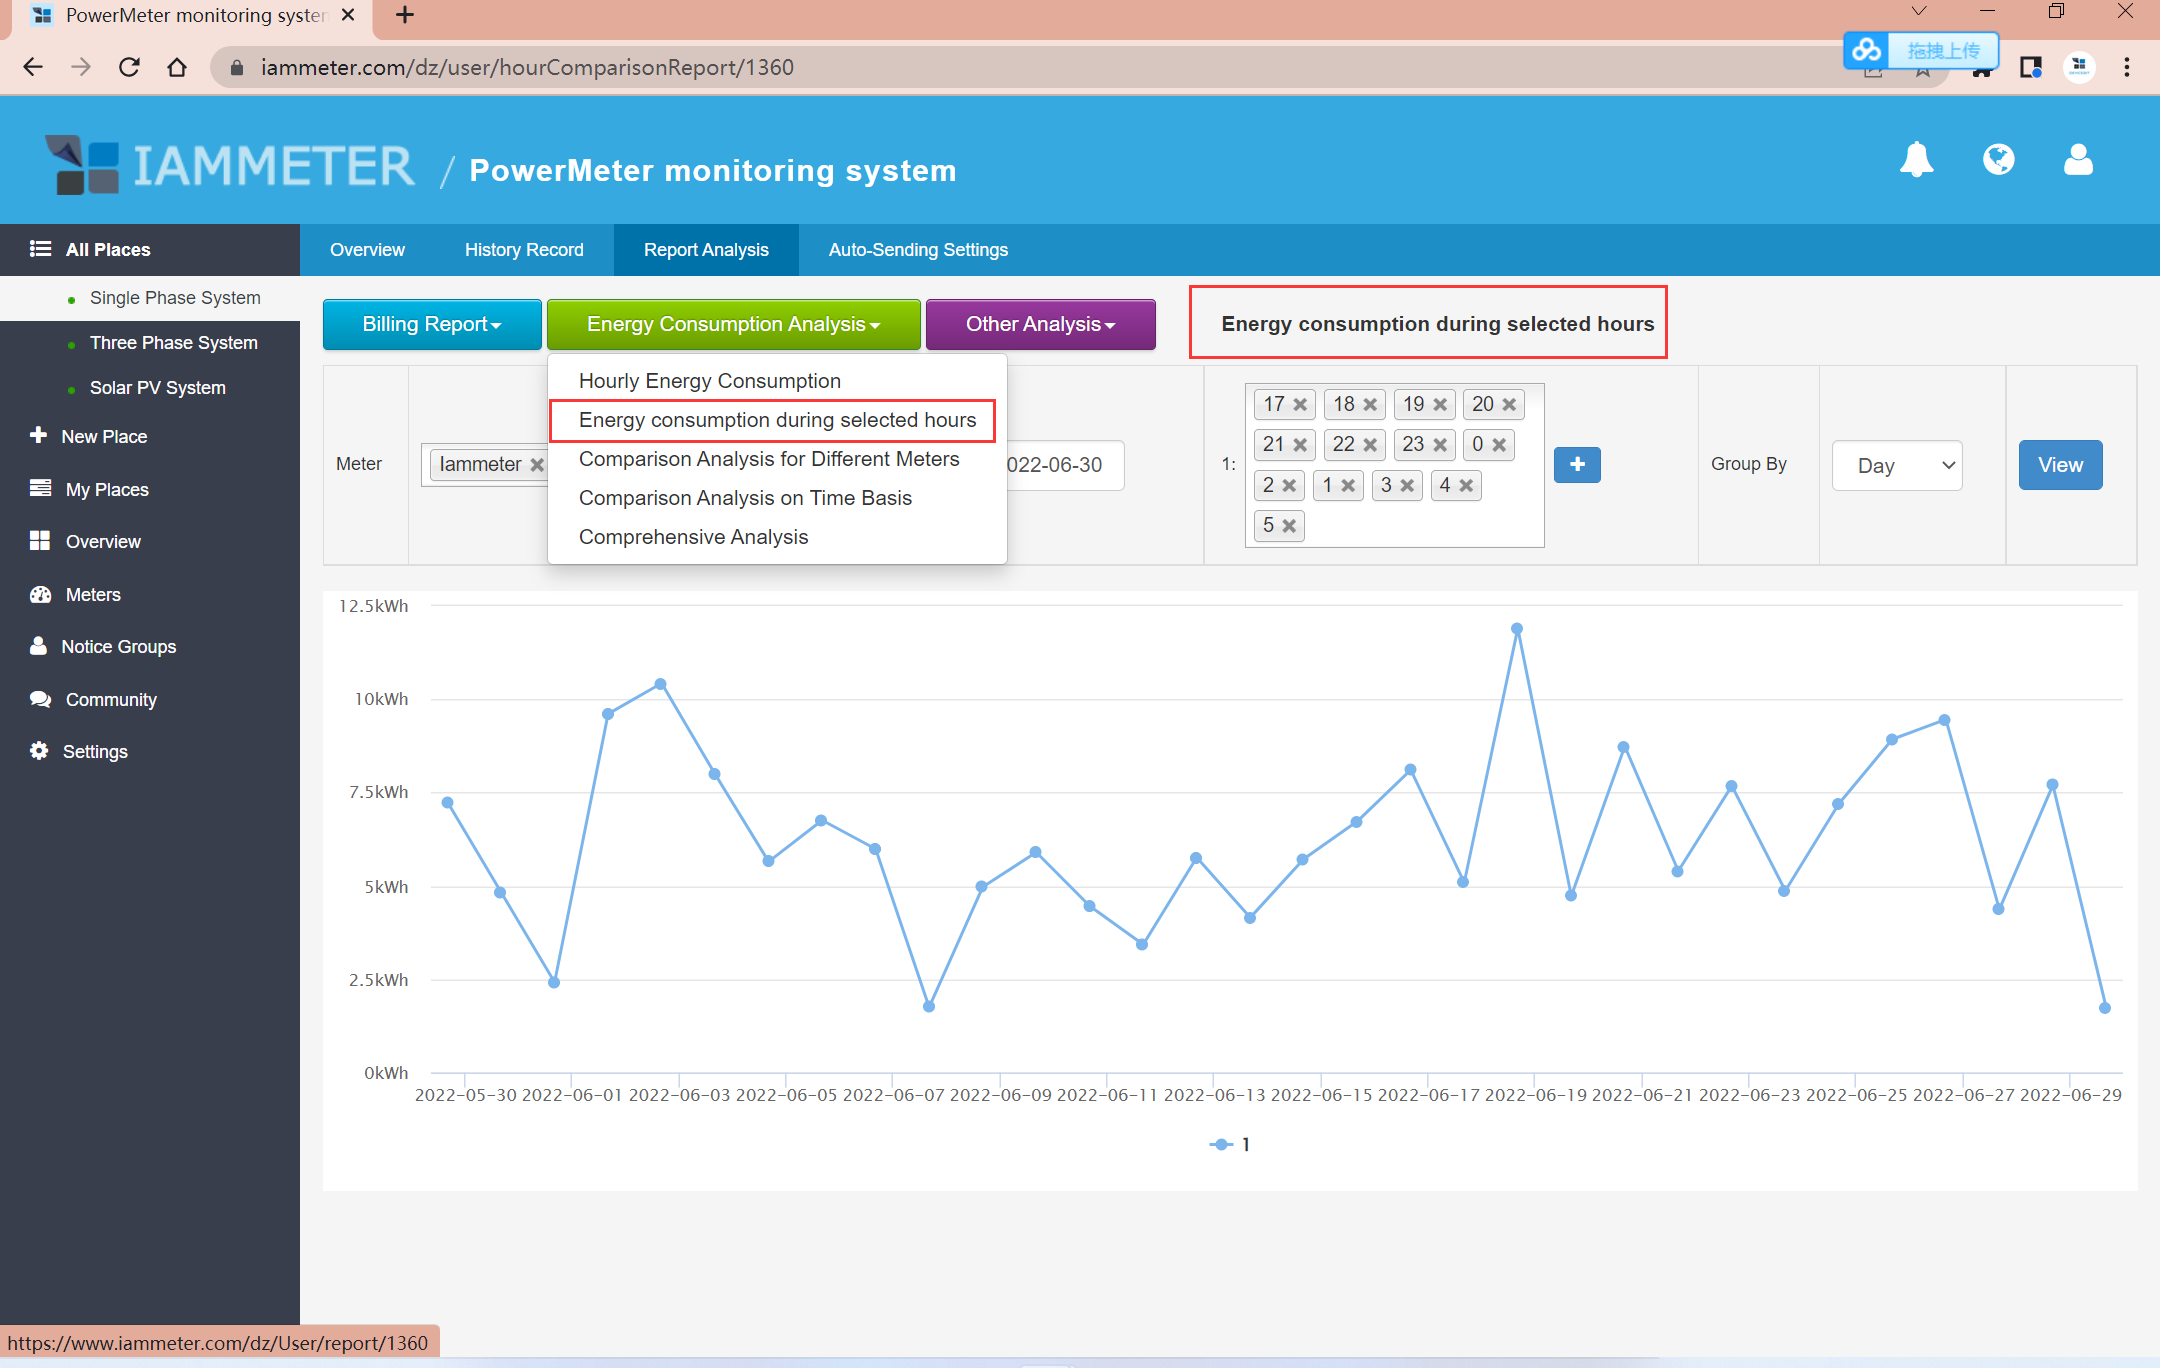
Hi, I am trying to calculate the size of the battery backup that I need for my house. In order to do so it would be helpful if there is a way to calculate the total (grid-) consumption during certain hours, as example from 17.00 to 0.700 when the sun is low or under. This would be needed not only per day but also per month or year, to see the general usage and if there are extremes in usage.
Rob.
I think this is a good suggestion, I have already forwarded it to my colleague who is responsible for the design of the IAMMETER cloud.
Maybe they will add a report that can be used to analyze the grid energy consumption of selected night hours.
Hello,
I like the colors used in Account Overview for Exported Energy ( rgb(142, 170, 67) ) and for Grid Consumption ( rgb(232, 81, 23) ), see https://www.screencast.com/t/XNjxGrJjt3bQ
I think it would be a good idea to have the same colors also in Overview (from left side menu) for Exported Energy and Grid Consumption.
https://www.screencast.com/t/xjwSmgZBiQl
Thank you!
Details about this funciton
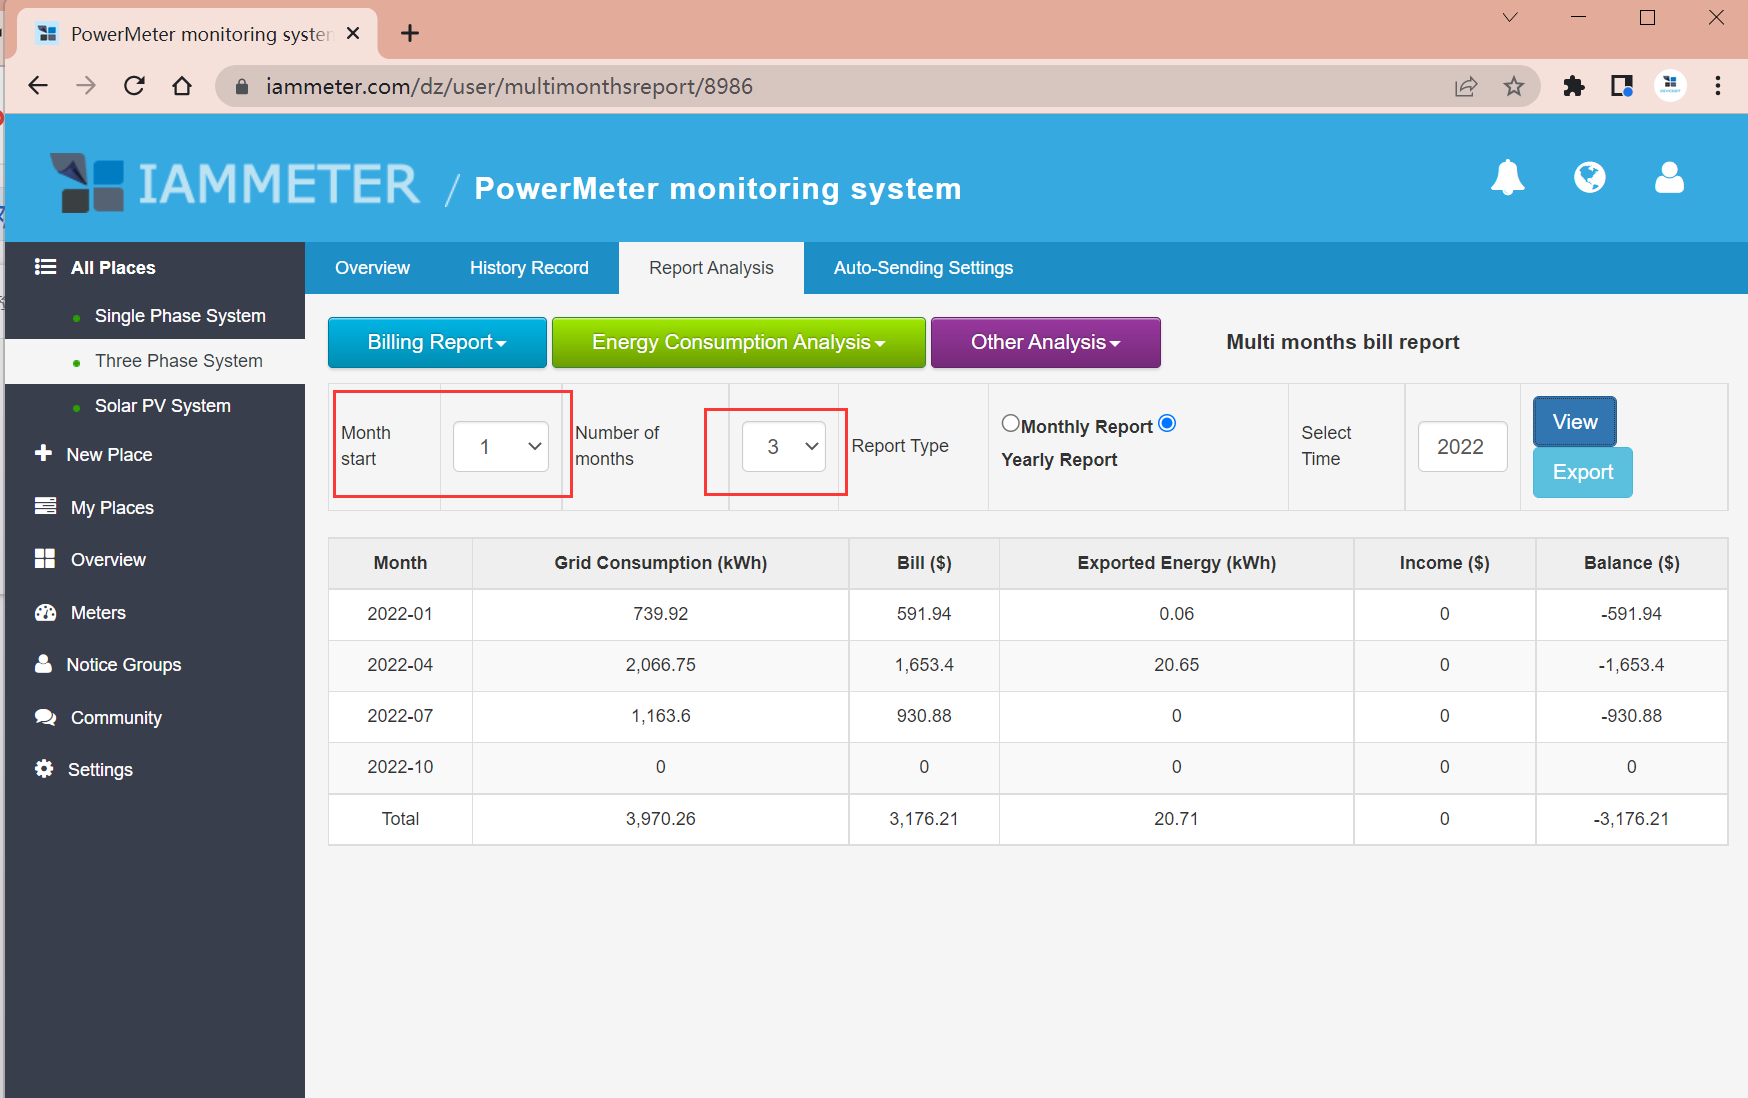
Could we run the billing report for a quarter (eg for 3 months)?

We are billed for our electricity on a quarterly basis so current reporting does not give a clear picture
Sorry for missing your suggestion before. We also think it is a good suggestion about the detail.
We will upgrade our system to adopt this suggestion.
Under the current DB structure, It would be a complicated jobs to support a billing cycle that is more than a month.
But we had already put this feature in our roadmap and will achieve it when we find a better method.
Thanks for letting us know.
I was thinking afterwards that perhaps you could just specify the number of months to report on. Would your DB structure support that?
What if it was a summary total for each month? So a quarterly report would only have 3 lines on it. Then run the individual monthly reports for the daily detail for a given month.. Eg. click on a month row to see the detail day by day for that month.
1: How do you know IAMMETER products
I was looking for a 3 phase energy meter with open APIs supporting highly accurate net metering. Found IAMMETER WEM3080T via Google search.
2: In your opinion, what is the most attractive feature of our product and system?
Net metering and open APIs. Not requiring the manufacturer's cloud for operation and integrating with the most popular home automation systems is a great thing!
3: What new features do you most want us to provide or upgrade?
In a perfect world, IAMMETER support would not have to be integrated into each application individually. I think that SunSpec Modbus would therefore make sense, providing an application layer for metering and other devices on top of Modbus, standardizing exchanged data points (register addresses and data formats). As Modbus is already supported, it is kind of a low hanging fruit.
Personally, I would like to see an easier way to properly reset energy counters and cloud data.
1: How do you know IAMMETER products
- A compact switchboard mount monitor that can connect locally to Home Assistant. Iammeter ticked the boxes.
2: In your opinion, what is the most attractive feature of our product and system?
- DIN Rail mount direct in switchboard, external antenna (no need for external enclosure).
- Variety of protocols to suit most monitoring packages.
3: What new features do you most want us to provide or upgrade?
- Longer antenna lead to bring antenna out of recessed switchboards
- Concurrent connections (e.g., Cloud & Modbus)
Hi Darren:
Thanks for your information.
we indeed have a long cable (3 meters) antenna model, but just provided for batch order now. we will consider to sell it as a spare part in future.
Concurrent connections (e.g., Cloud & Modbus)
Hi, it is already supported now, you can use the IAMMETER-cloud service together with the Modbus/TCP.
Hi @laoliu,
Thank you for clarifying the concurrent connections. Due to the 'Run Mode' drop-down listing Cloud/TCP/HTTP separately, I didn't even think to try.
Hi:
Cloud: it will upload data to IAMMETER-cloud
TCP: including MQTT, TCP, and tls mode
HTTP: including HTTP and HTTPS
These three modes are separate which means you can just run one mode at one time.
In all these three modes, the energy meter works as a client.
This means when you upload the data to your own server (by HTTP MQTT TCP or TLS), you can not upload the data to IAMMETER at the same time.
But the Modbus/TCP can be used together with them.
It works as a server in the modbus/tcp polling.
So it can reply the modbus request in any run mode options.
The Modbus/TCP is more like this local API mode, can be used together with any run mode .
https://www.iammeter.com/docs/integrate-with-PVOutput
I actually feel a bit silly on this one.
I've changed from the HACS integration to Modbus and solved a synchronisation issue I was having aligning with my other sensors (solar and device sensors).
If I'd read things properly in the first place, I could have saved myself a lot of headaches.
Thank you again.
Could we be able to export data from this graph into a csv file? That would be very useful for analysis. 1st colum to be date and time, then each meter side by side.
Thanks. I have been writing out data by hand which is very time consuming.
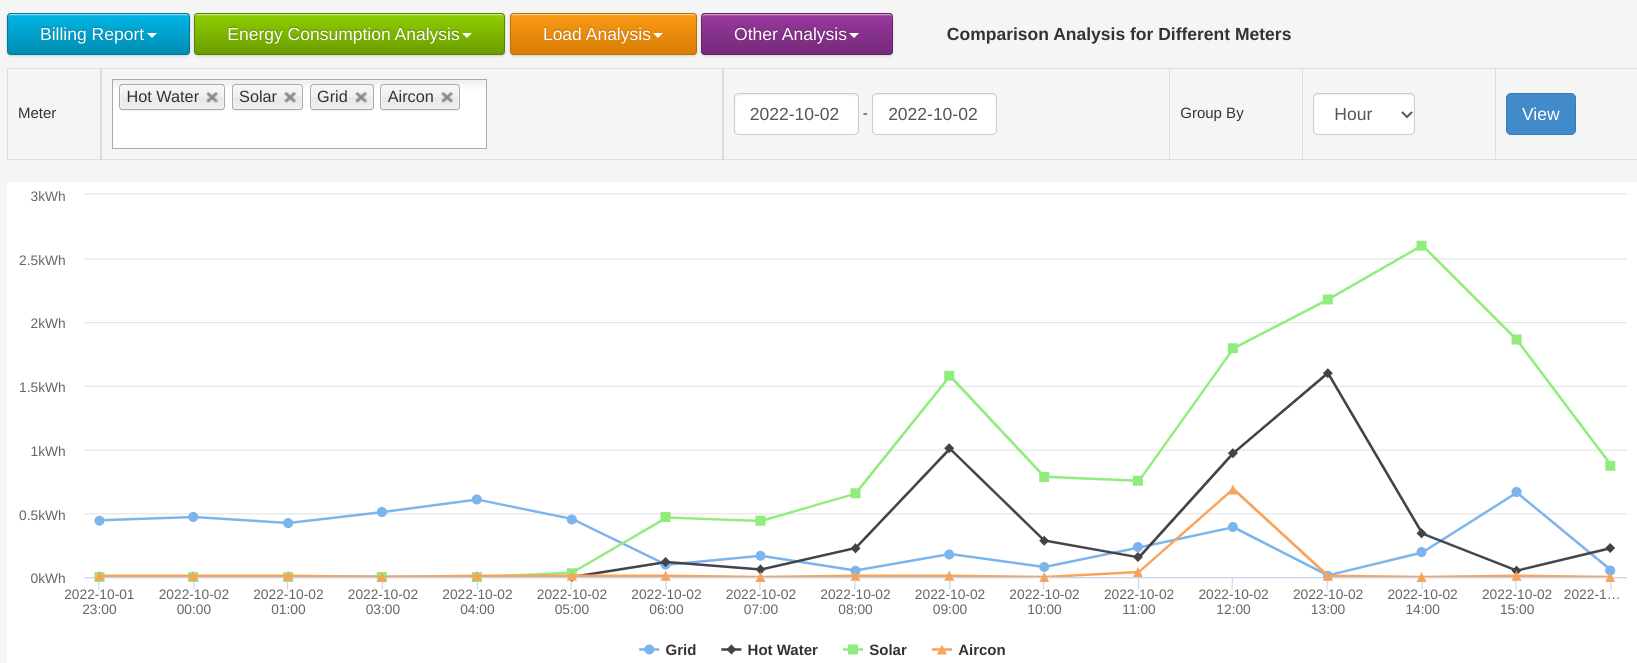
Done && thanks for your suggestion.
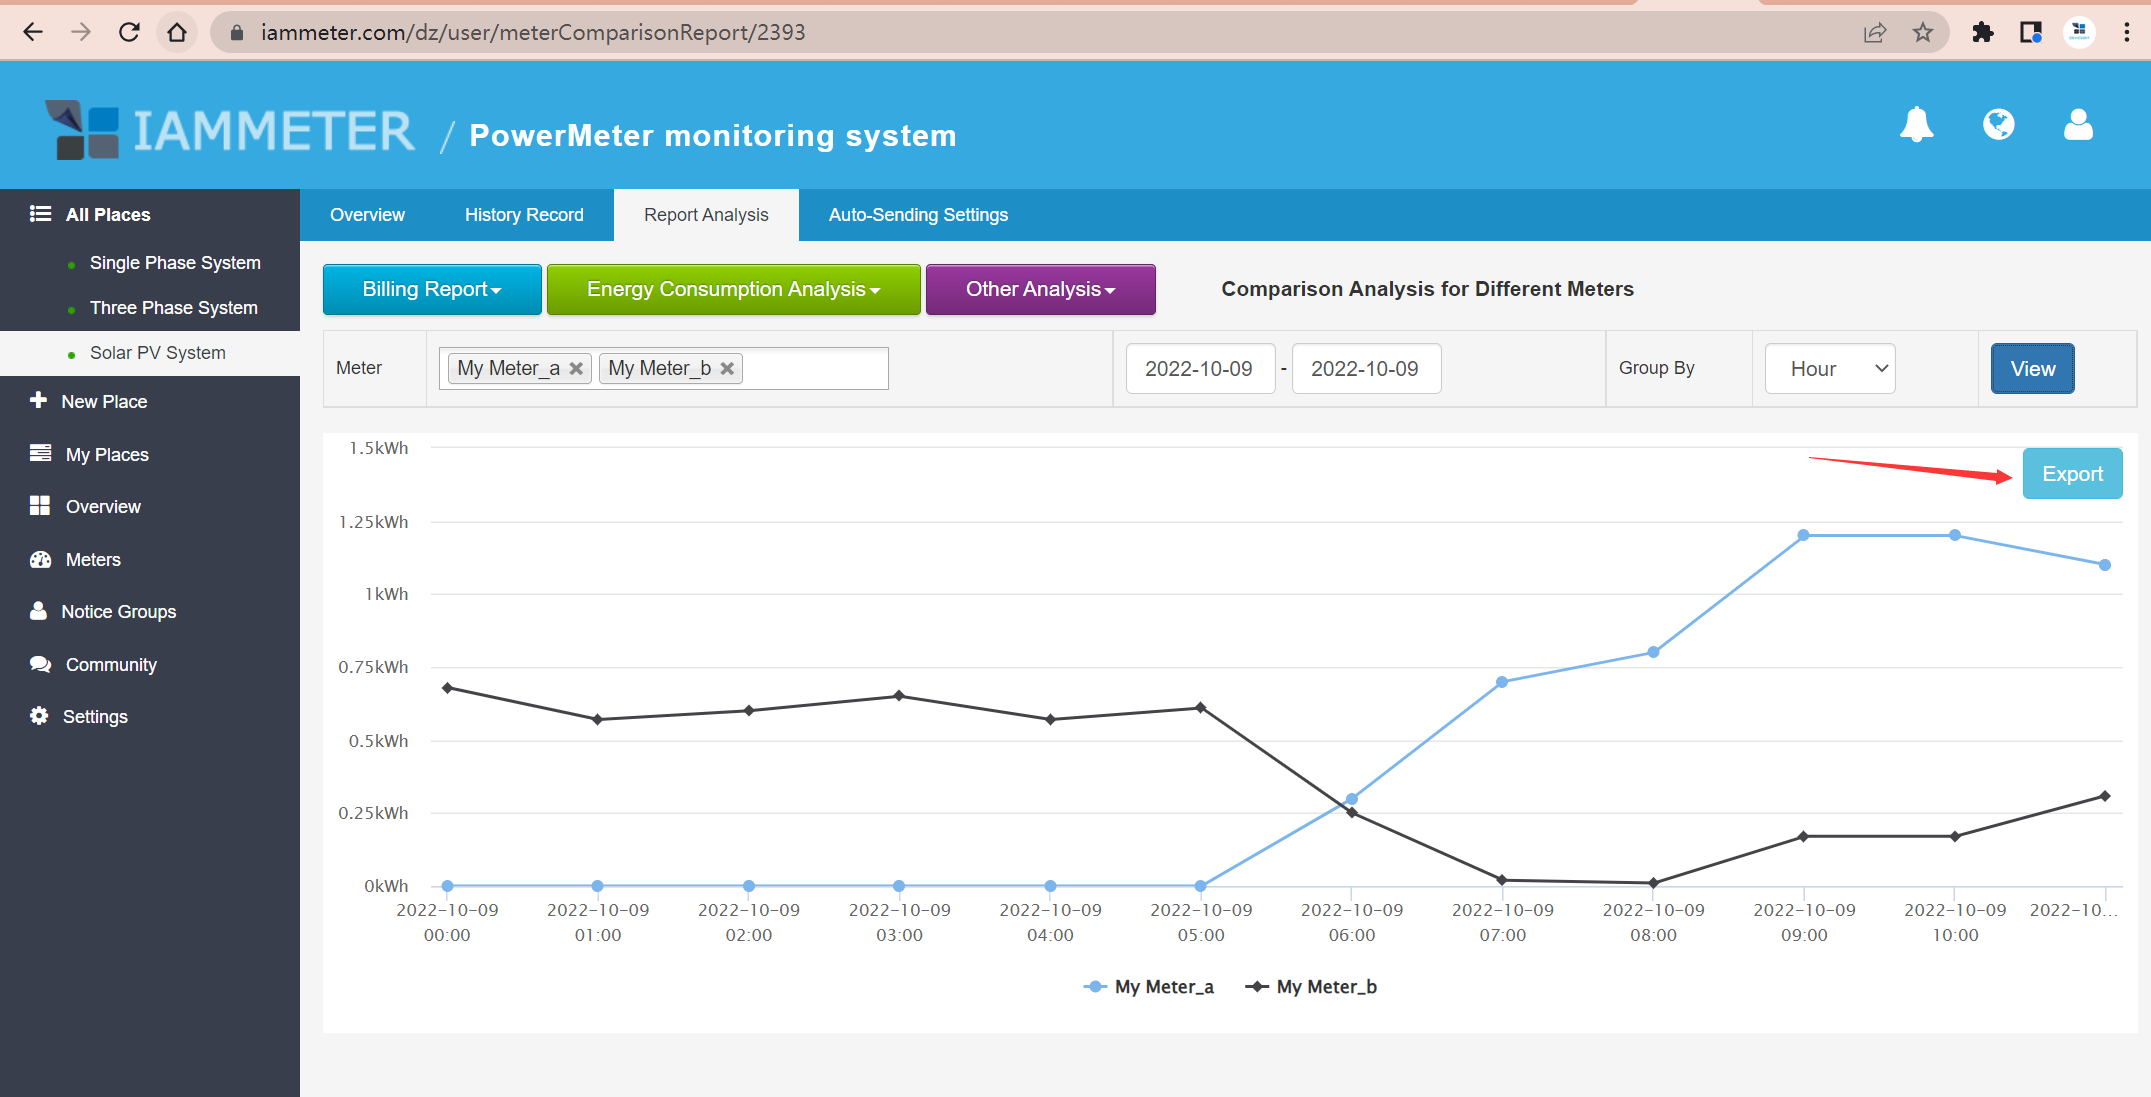
Most of the suggestions under this topic had already been supported.
Please let us know your new thought.
I have 2 WEM3080T meters installed. One on a 3 phase on-grid inverter and one on the 3 phase power line coming in from the grid.
Been using these for about 2 years now and they have been working flawlessly. The two combined also provide a flow chart.
I have one suggestion, if possible, please make the app/web interface show the exported/imported energy in real time or perhaps update every 2 minutes, currently I need to wait till 15 past the hour to see what was exported/imported the previous hour.
The 12 second or so update is very useful, would be amazing if the imported and exported energy is also posted/refreshed every few seconds.
Keep up the amazing work, I have not come across a better device for energy monitoring especially if you have a solar system installed.
Worth every penny and more!
Hi, I've been using the system for a while.

I suggest placing an extra line in the report, showing the difference between exported and consumed energy in kW.

That way we would have a more direct answer to the most important question, how much free will I have?

Grateful
1: Encontré los productos IAMMETER gracias a sus tutoriales de youtube.
2: Muestra las graficas de diferentes valores y además de sus análisis de costos, me gusta mucho.
3: En Perú donde estoy usando este producto. La compañía de energía eléctrica a algunos clientes les cobra la energía reactiva (Kvarh), he buscado este valor pero no la encuentro, solo puedo ver la potencia reactiva (Kvar). Me gustaría que también se pueda ver la cantidad y la grafica de la energía reactiva (Kvarh). Además de poder configurarlo su costo en hora punta y fuera de hora punta. Le adjunto una imagen para que vea que cobran por la energía reactiva. Sería bueno poder ver esta característica y comprobar que la compañía eléctrica esta cobrando lo justo.
Hi:
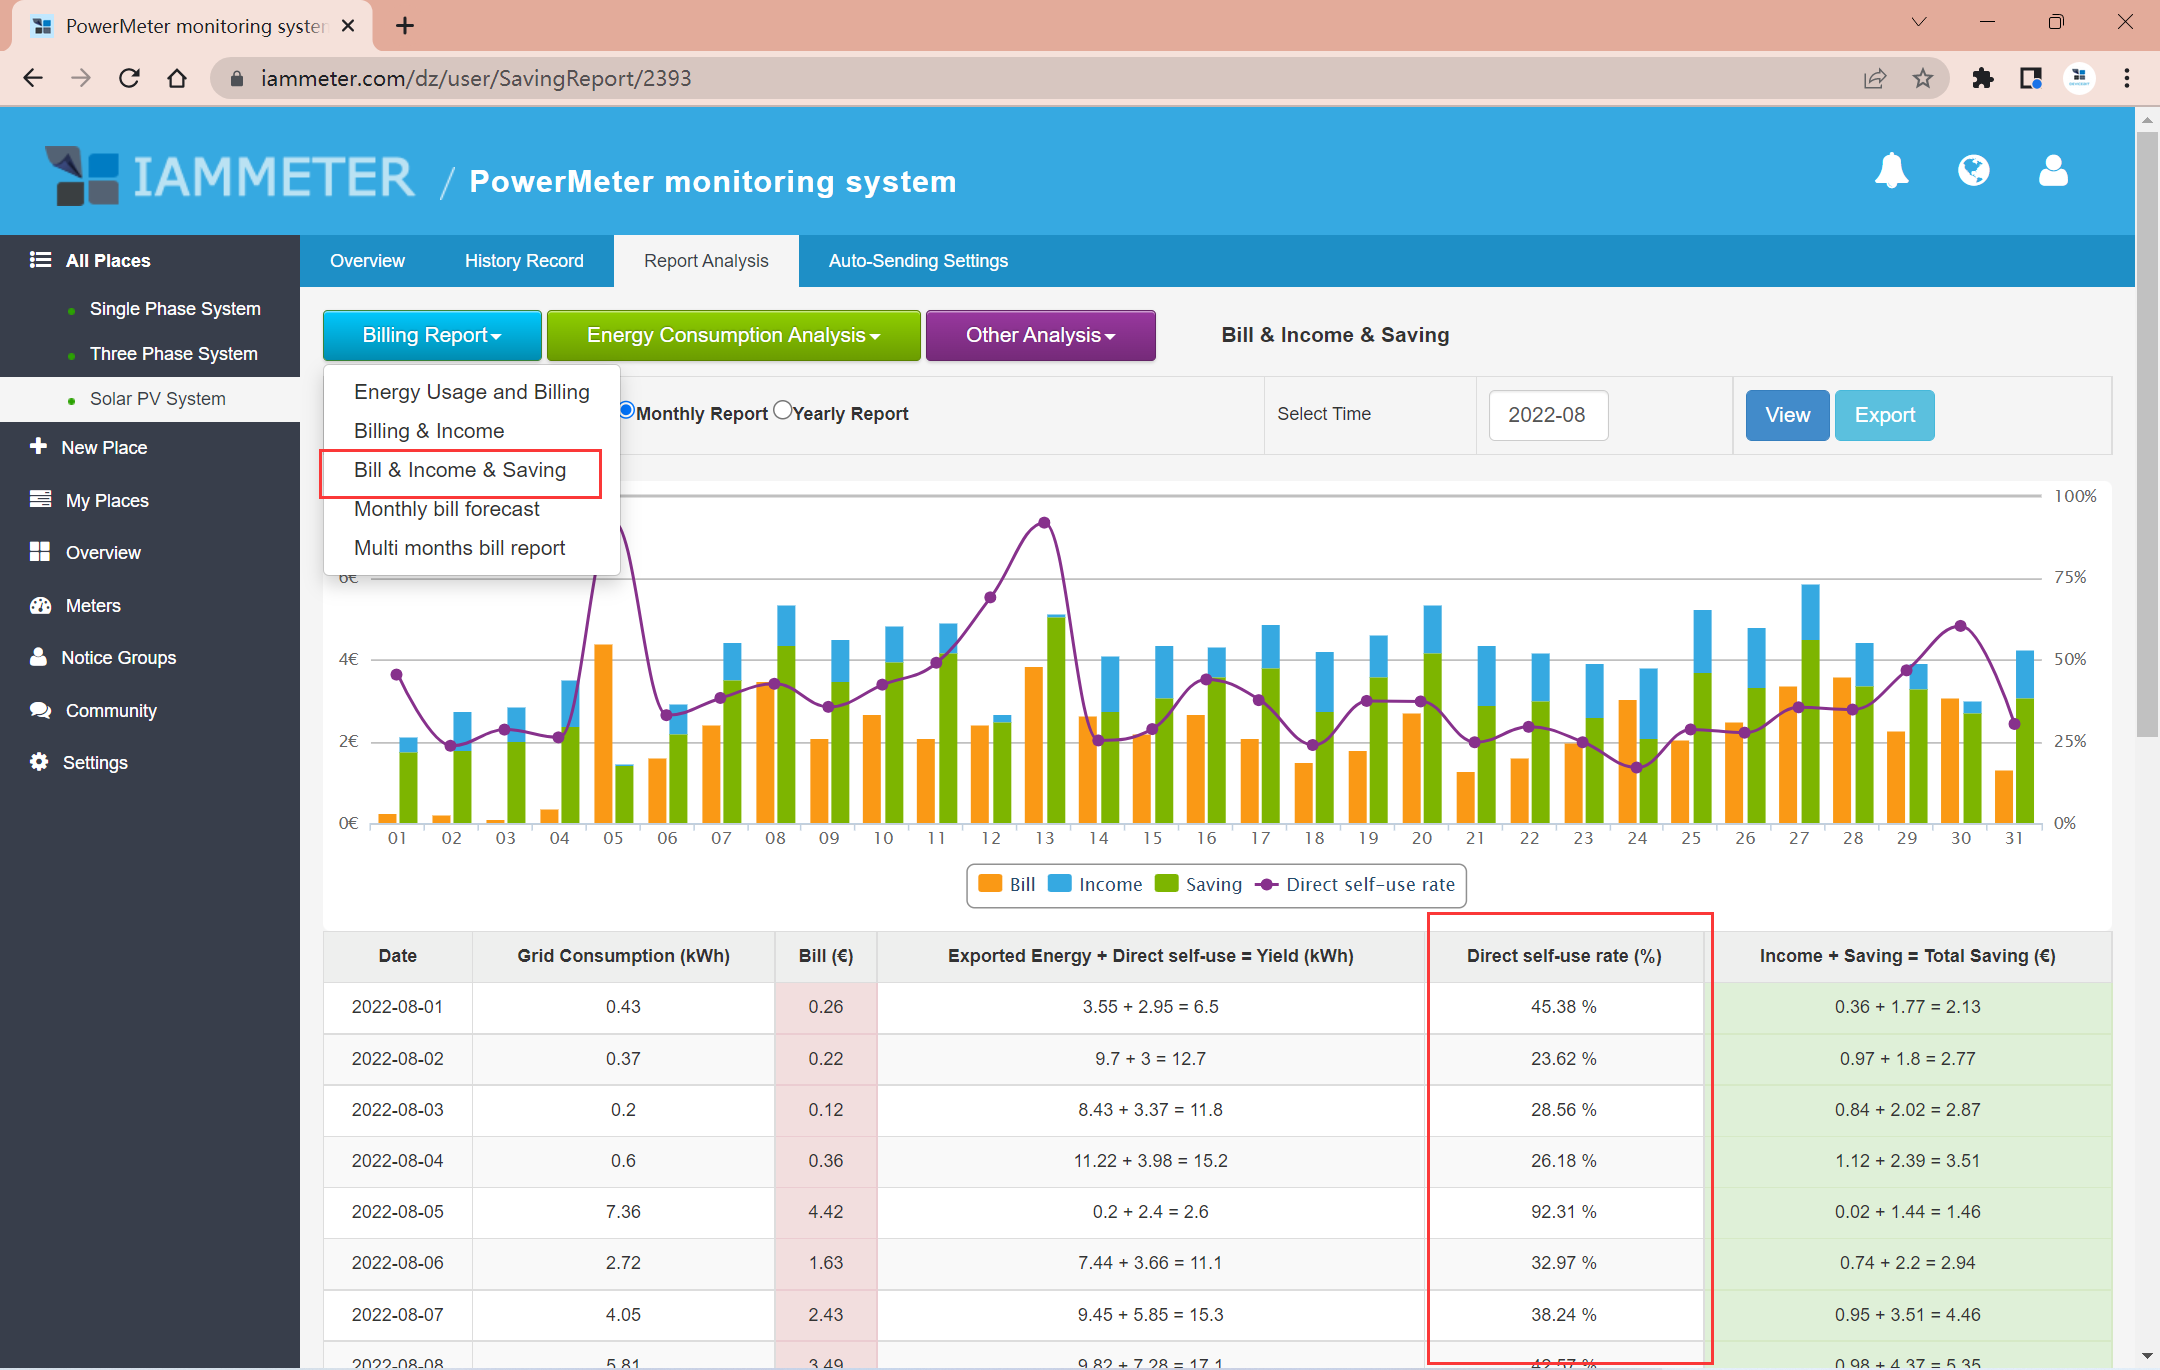
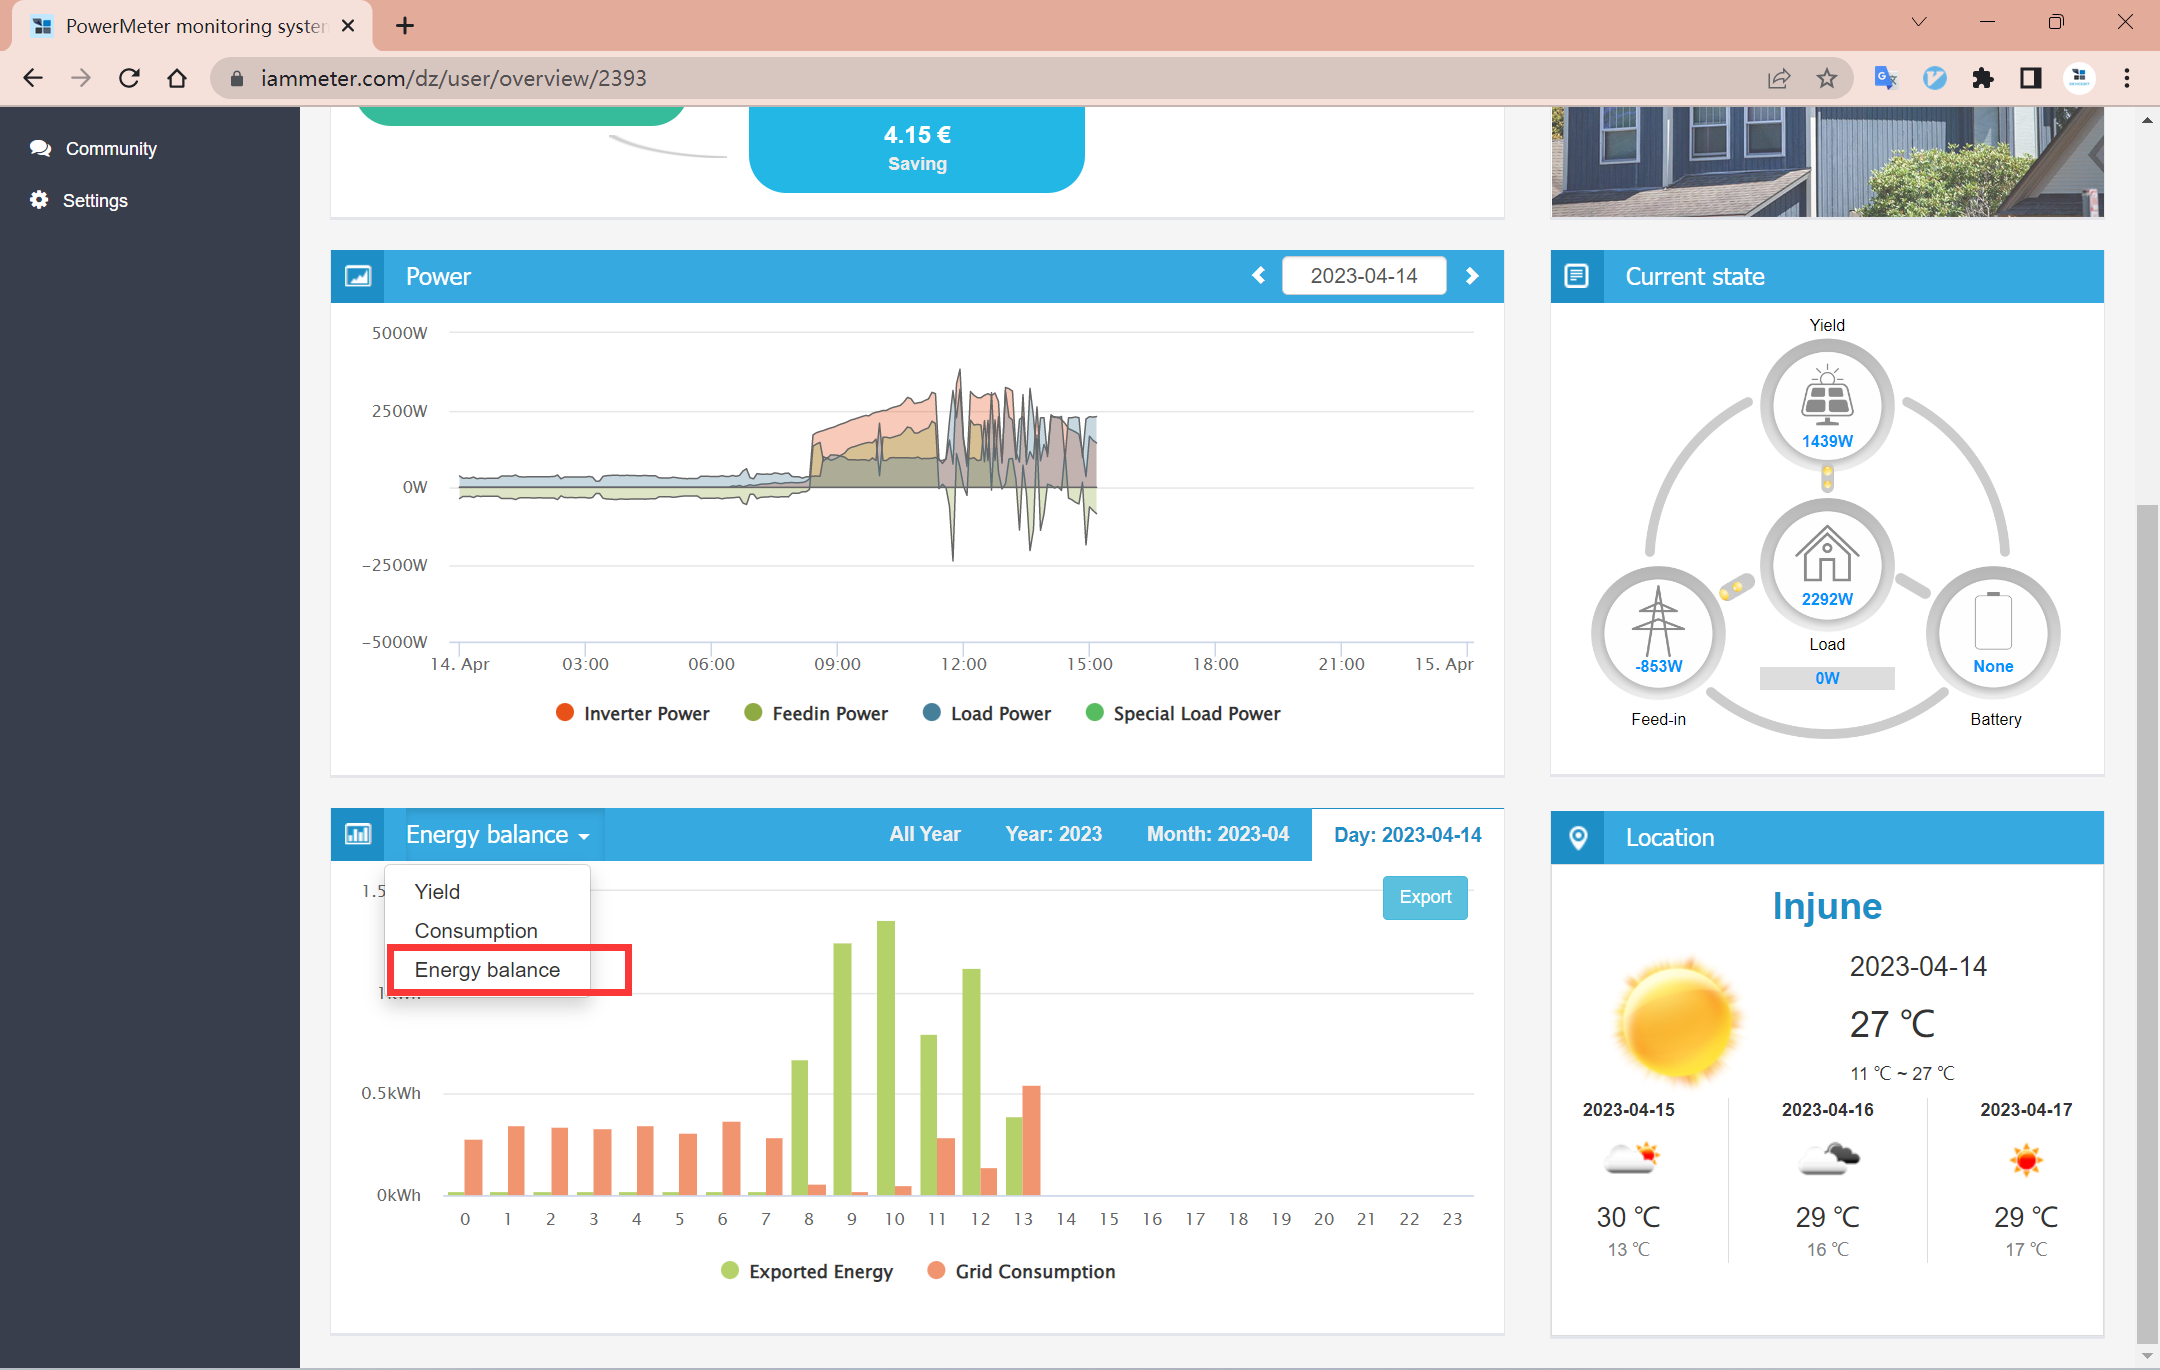
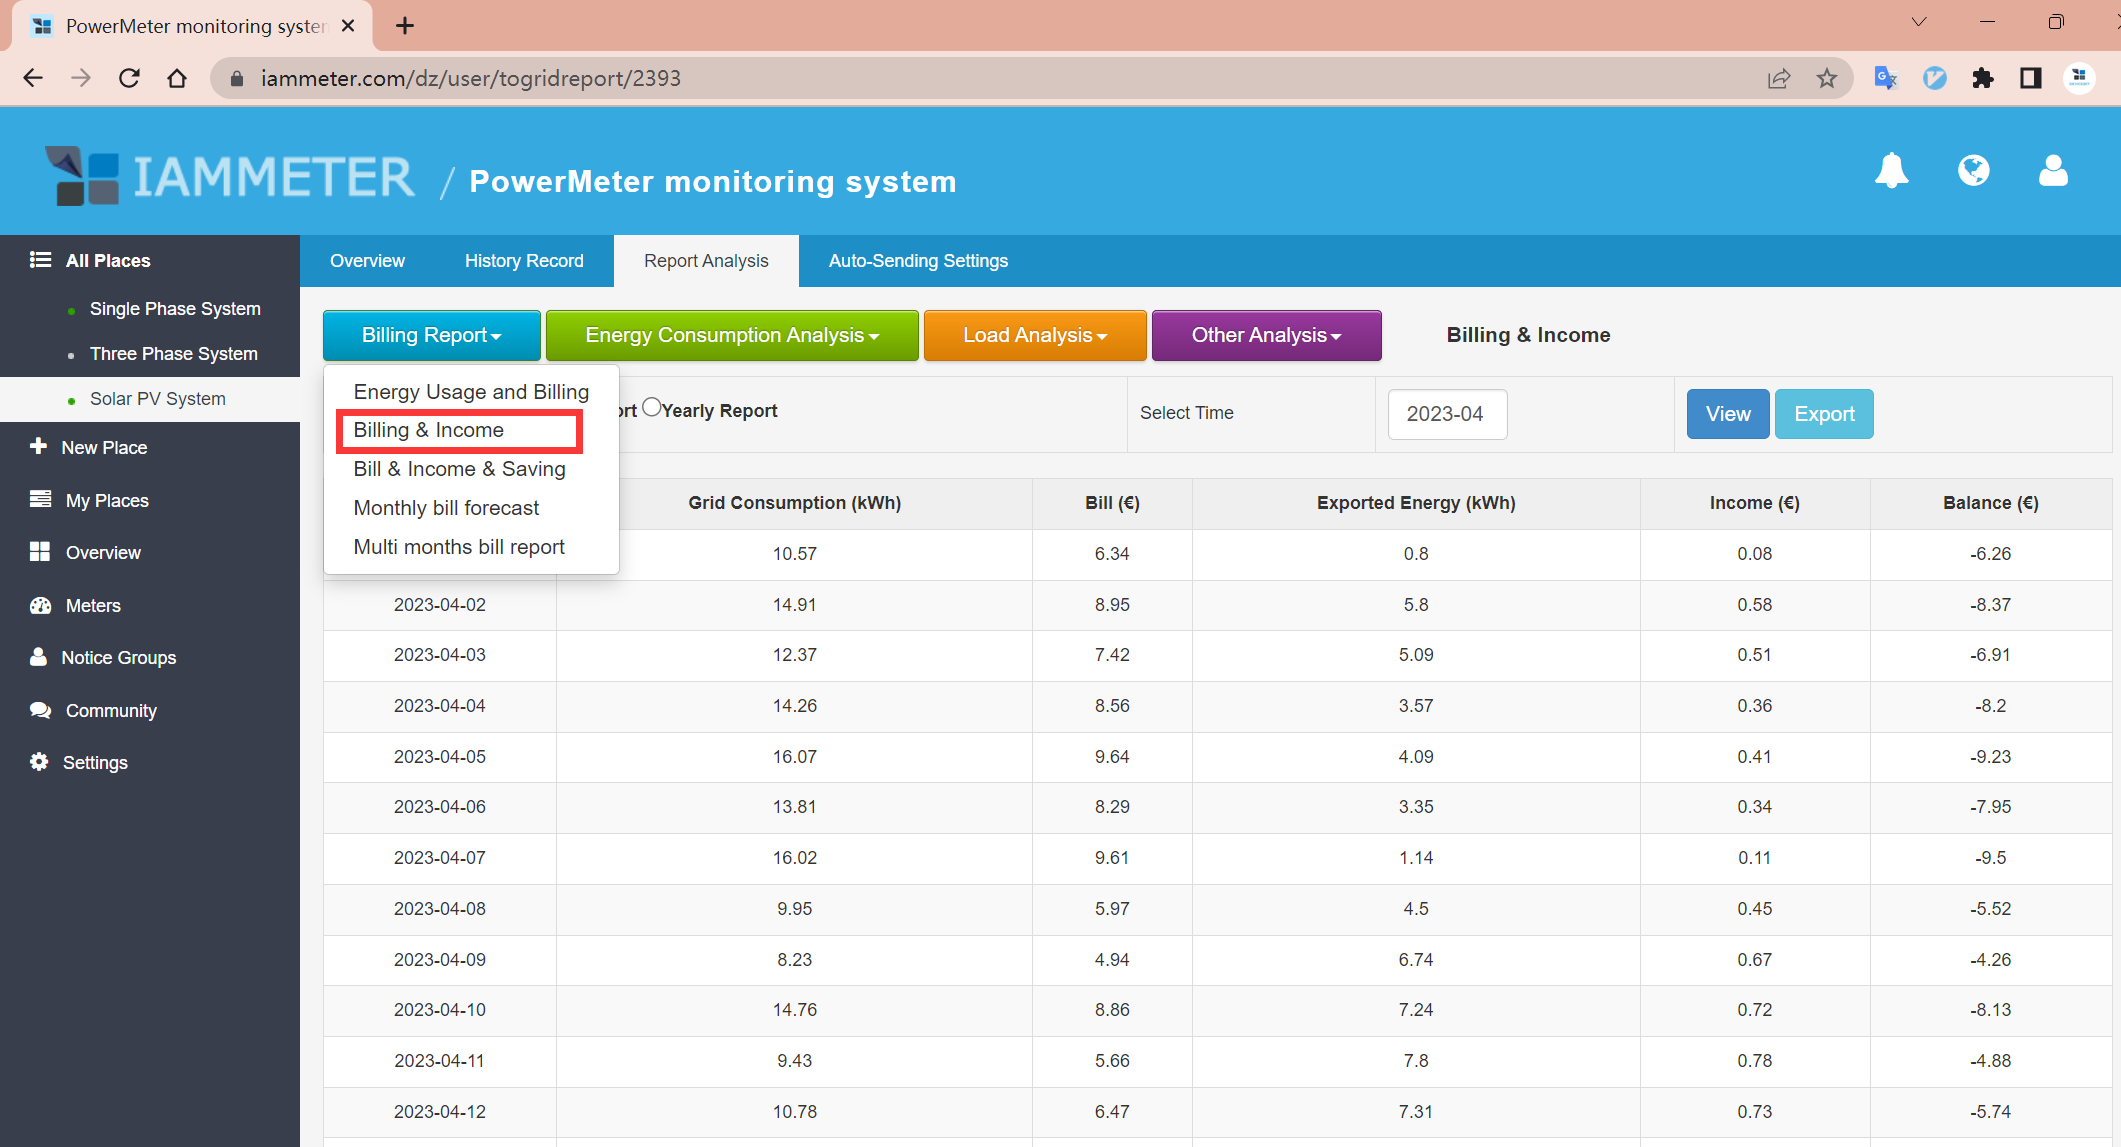
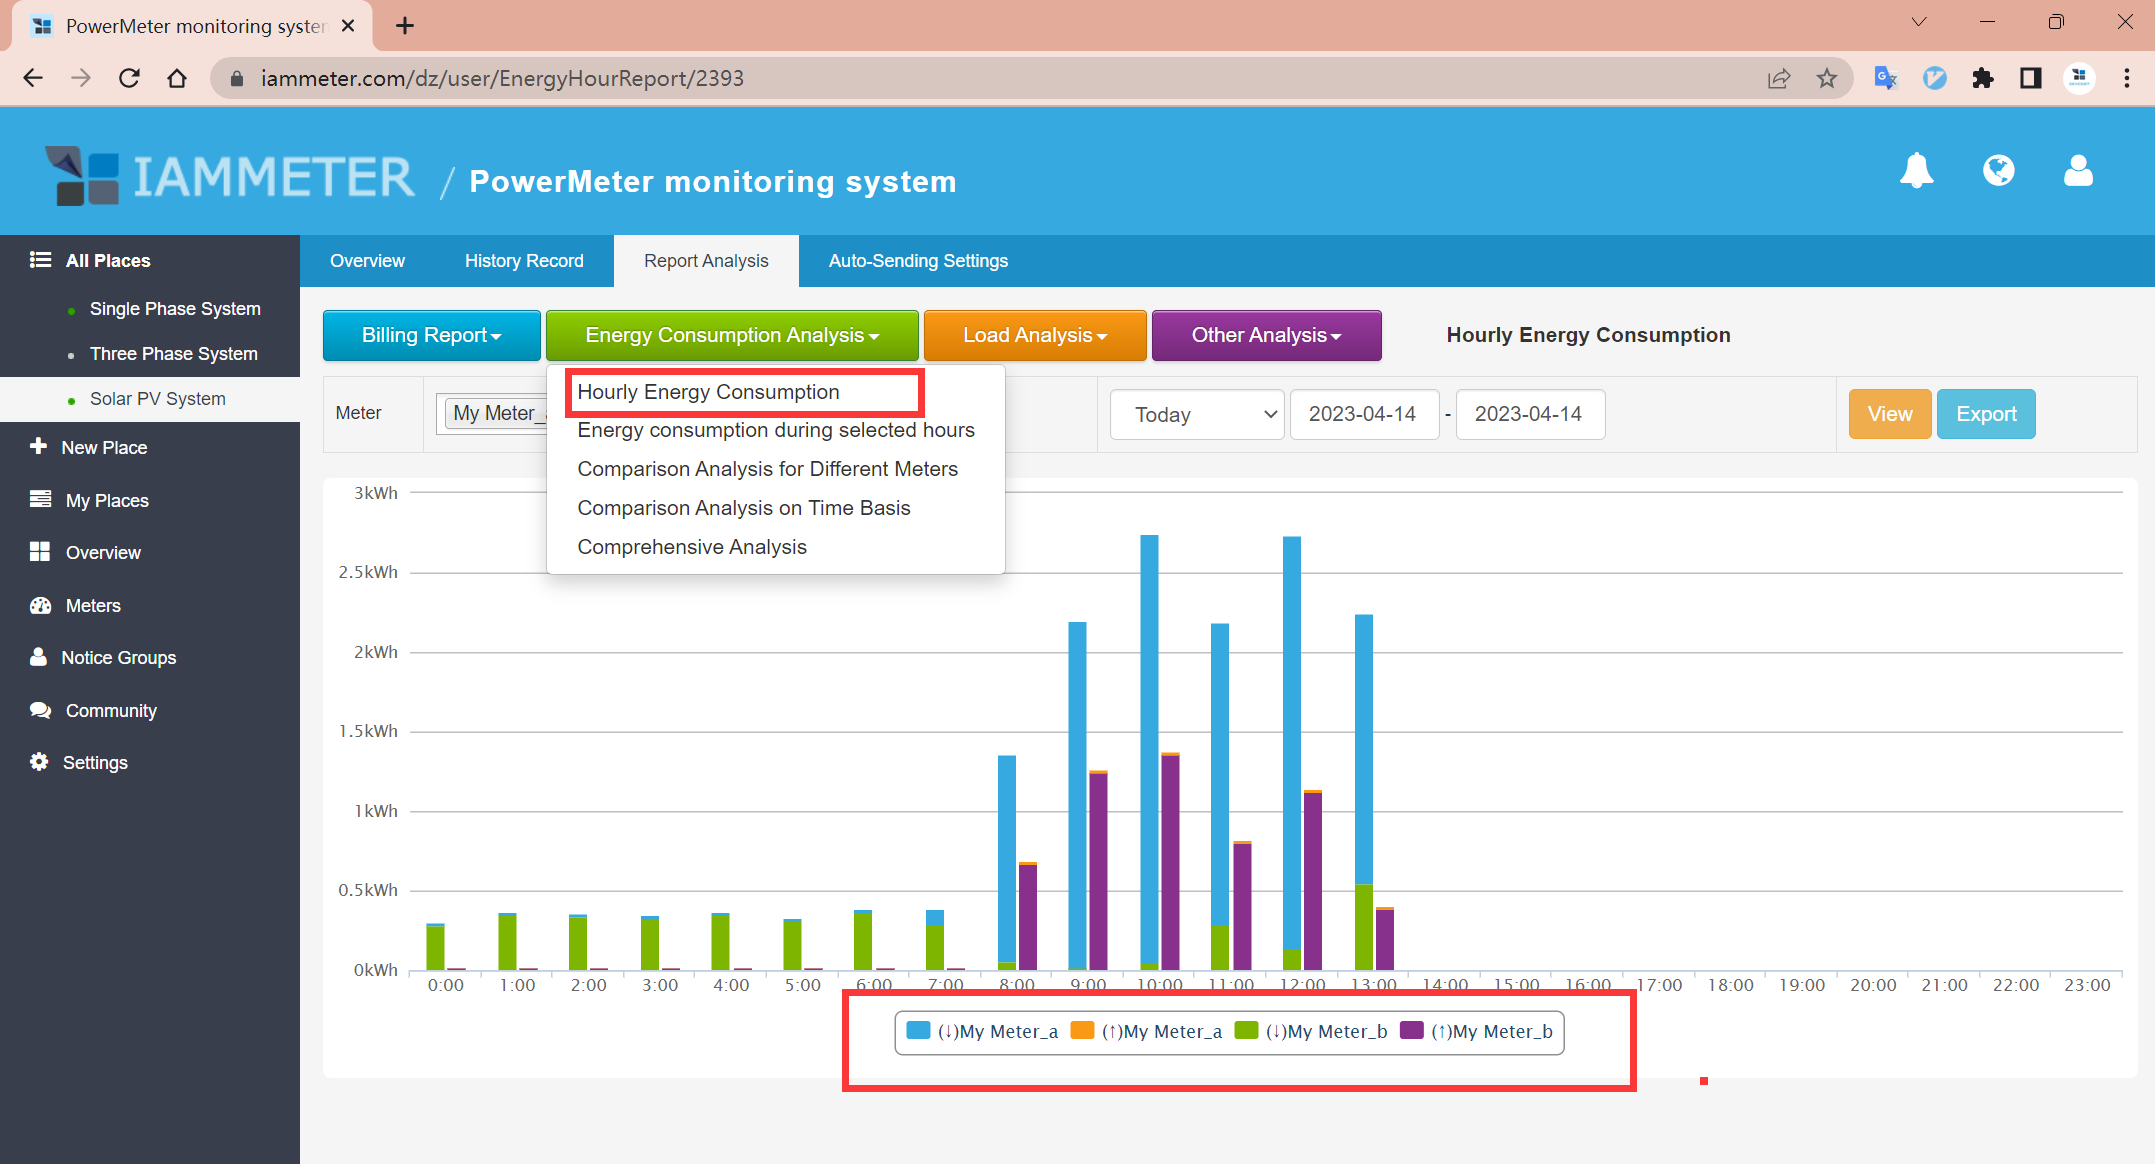
If you want to compare the exported kWh and imported(consumed) kWh, there are some reports or graphs that can be concerned about.
1 Report: Bill&Income&Saving
2 Graph: Energy balance in the overview page.
3 Report: bill&income
4 Report: hourly energy consumption
I suggest placing an extra line in the report, showing the difference between exported and consumed energy in kW.
That way we would have a more direct answer to the most important question, how much free will I have?
Grateful
Sorry , the current WEM3080T can not measure the reactive power or reactive total (Kvar or Kvarh) , we plan to provide a new meter later that provides such parameters
Hi:
Sorry for the late replies,we already support these features
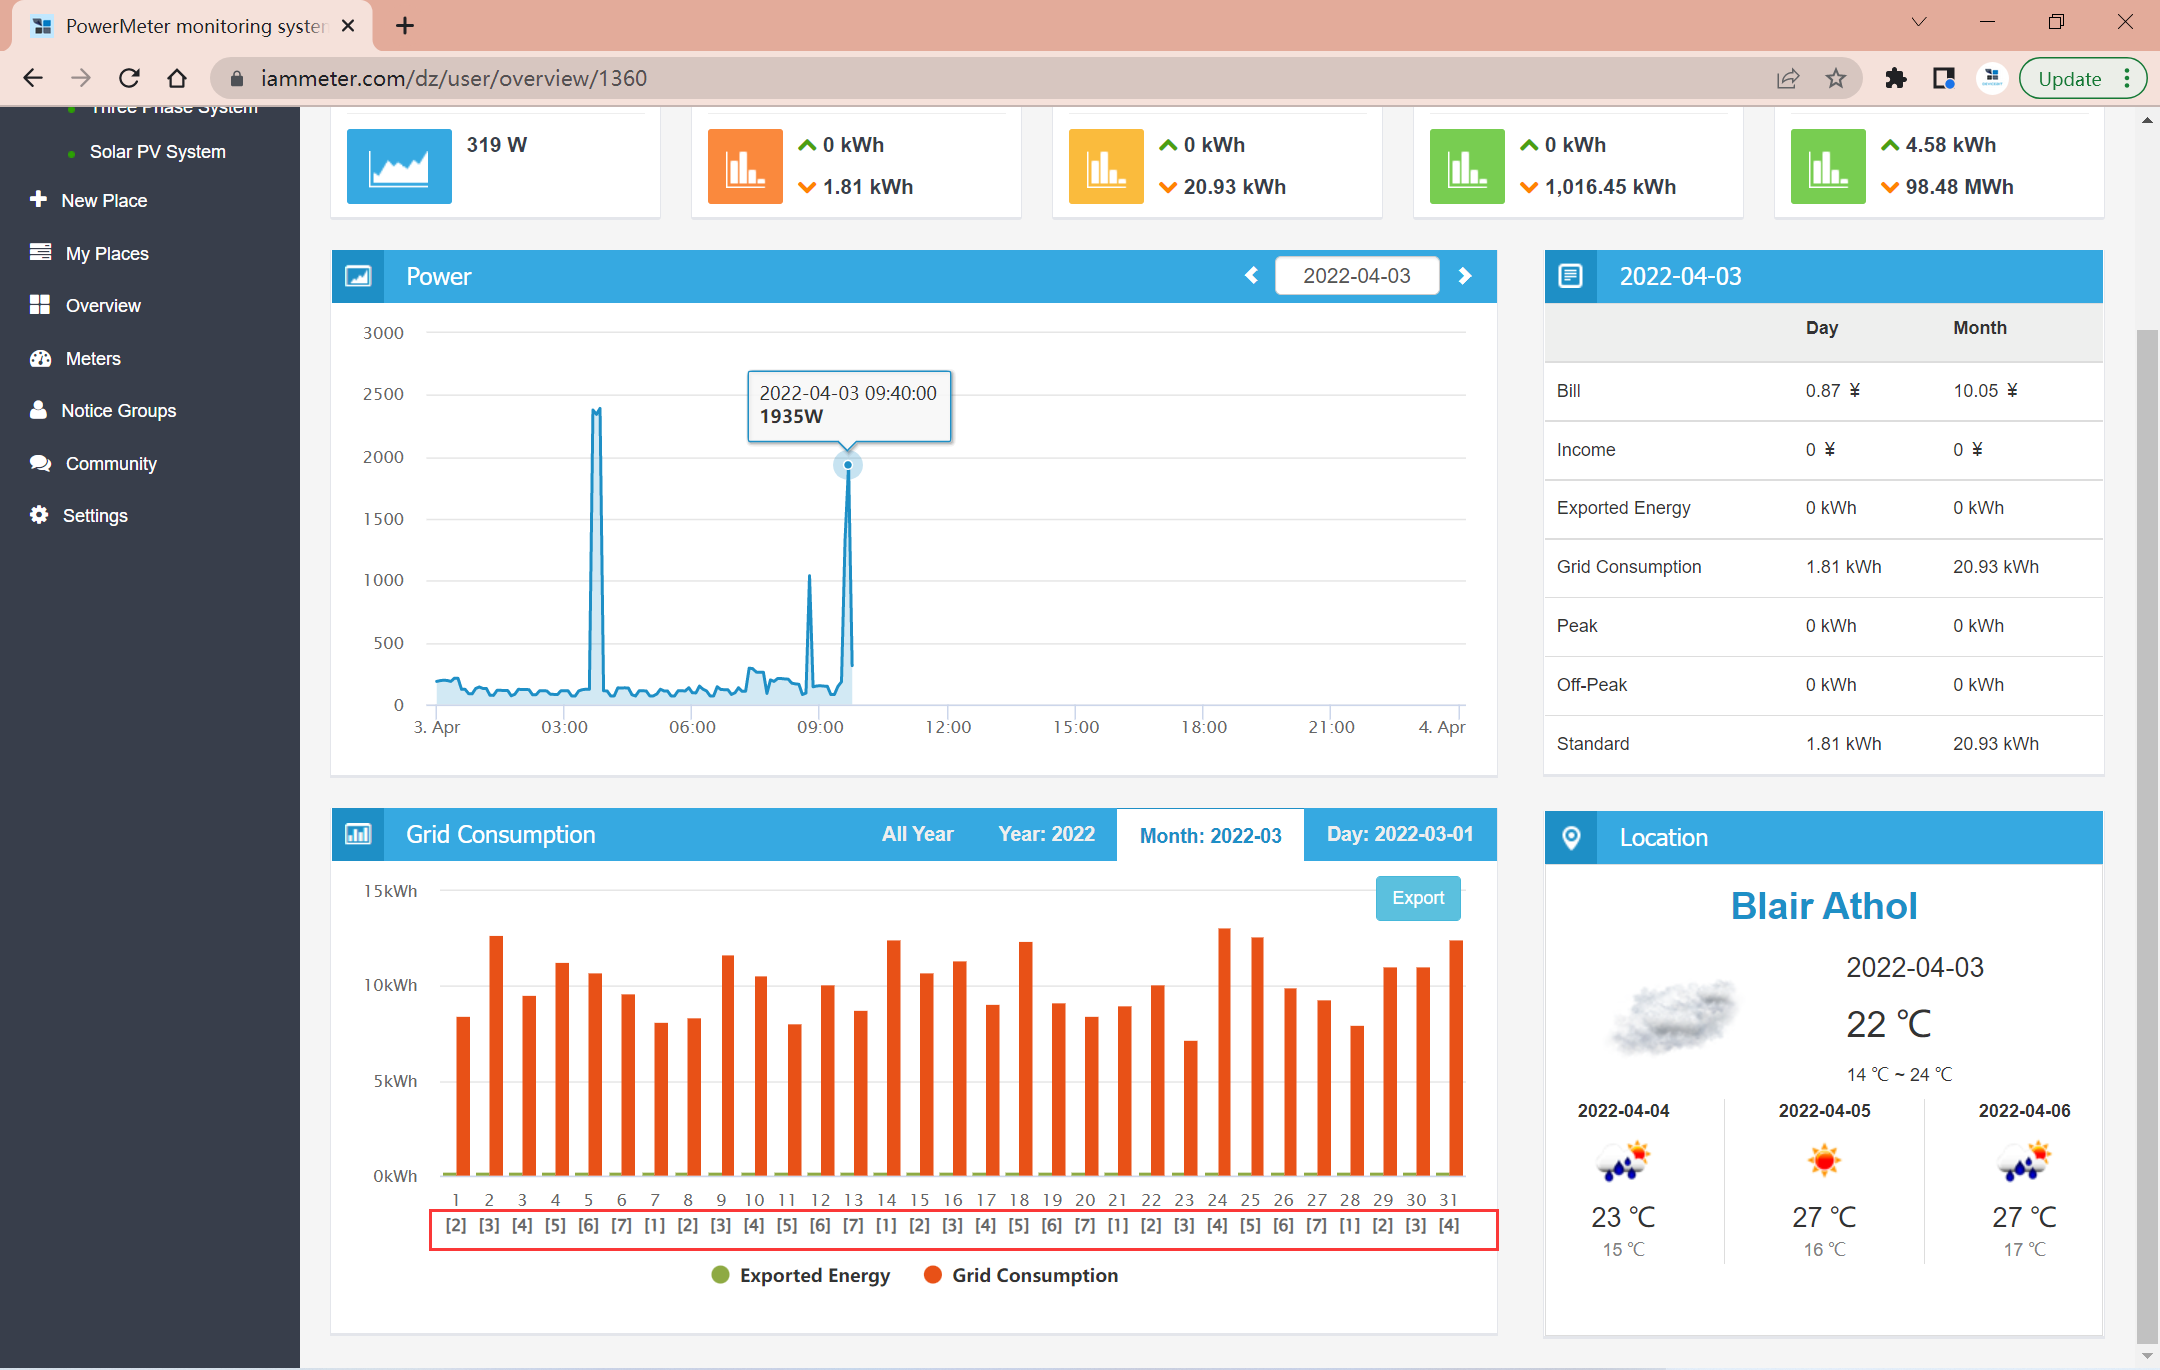
Desculpe minha falta de conhecimento mas, como leio o dia da semana corretamente, no meu indica dia 16/04/2023 marca um (6). o que significa isso? me ajude a interpretar.
Agradeço pelas respostas colocadas anteriormente
Do you mean the [7] in the red rectangle below pic?
It means that is Sunday.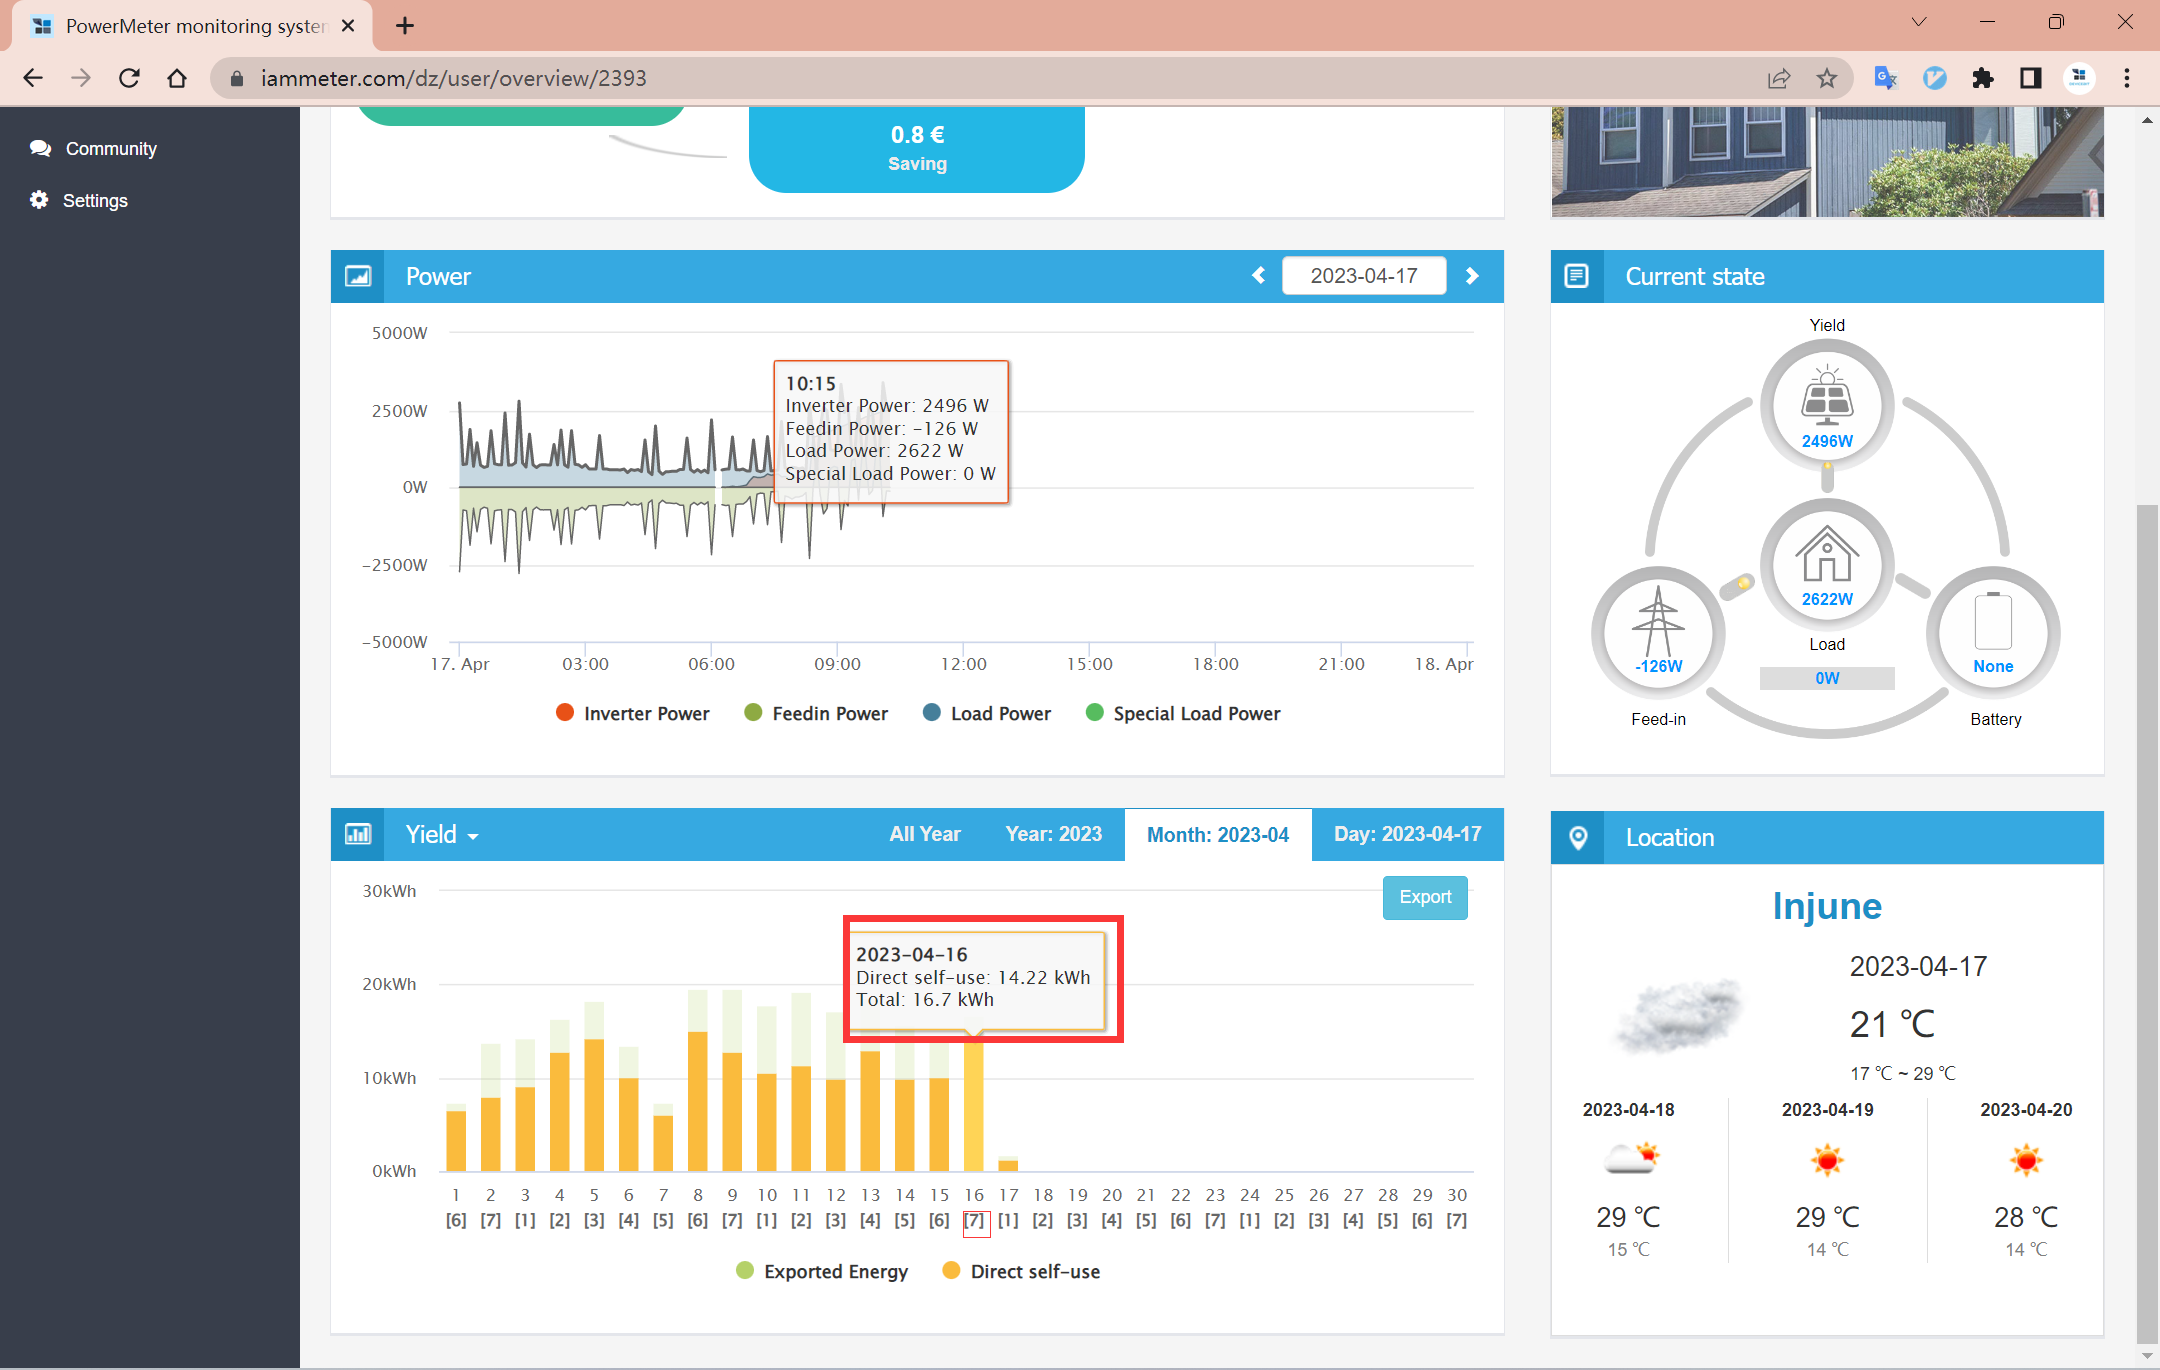
exatamente essa indicação mas, no meu caso, esta toda estranha. vou enviar uma imagem.
O mês mostrado esta errado. O dia da semana (ex.:17) do mês 3 e 4 também não batem com os dias da suas semanas no calendário então, não sei o que esta acontecendo.
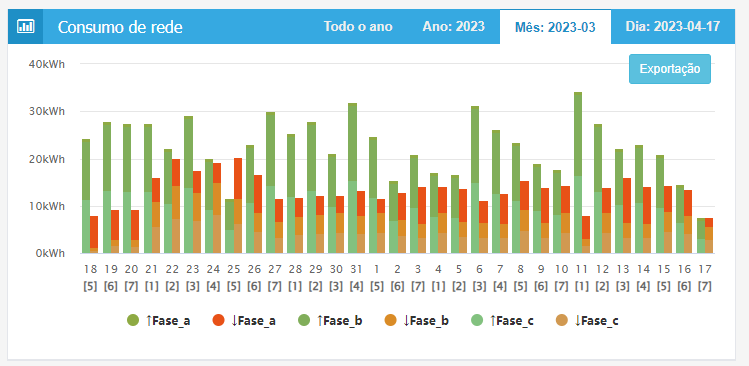
thanks, My colleague replies to me that is a bug of our JS in webpage.
We have just already fixed it , please check it again.
Ola, percebi a mudança. agora a data esta correta. Muito agradecido.
Tenho outras perguntas para aprimorar meu monitoramento mas seria útil uma conversa mais direta para mostrar como esta o sistema e como poderia fazer funcionar aqui, o que tenho montado na minha casa que é um sistema trifásico mas com injeção solar em 2 fases. Como ligar isso corretamente. no momento estou usando o básico que me atende mas sei das possibilidades do equipamento e queria explorar essa oportunidade de aprender.
Porém, já estou gato pela ajuda até aqui
Hi:
This post is with regard to the suggestions.
If you meet any questions in use, please post a new topic and describes you question as detailed as possible.
we have planned to add kvar and kvarh in WME3080T later.
It contains the reactive power of each phase, the positive value represents inductive load and the negative value represents capacitive load.
There are two kvarh values in each phase, one represents the kvarh of inductive load , another represents the kvarh of capacitive load.
So appreciate your reviews.
we will shorten the time of refreshing the hourly kWh in next upgrading, to make it as real-time as possible.
Hi:
We have just upgraded the system, the hourly kWh is the realtime value now.
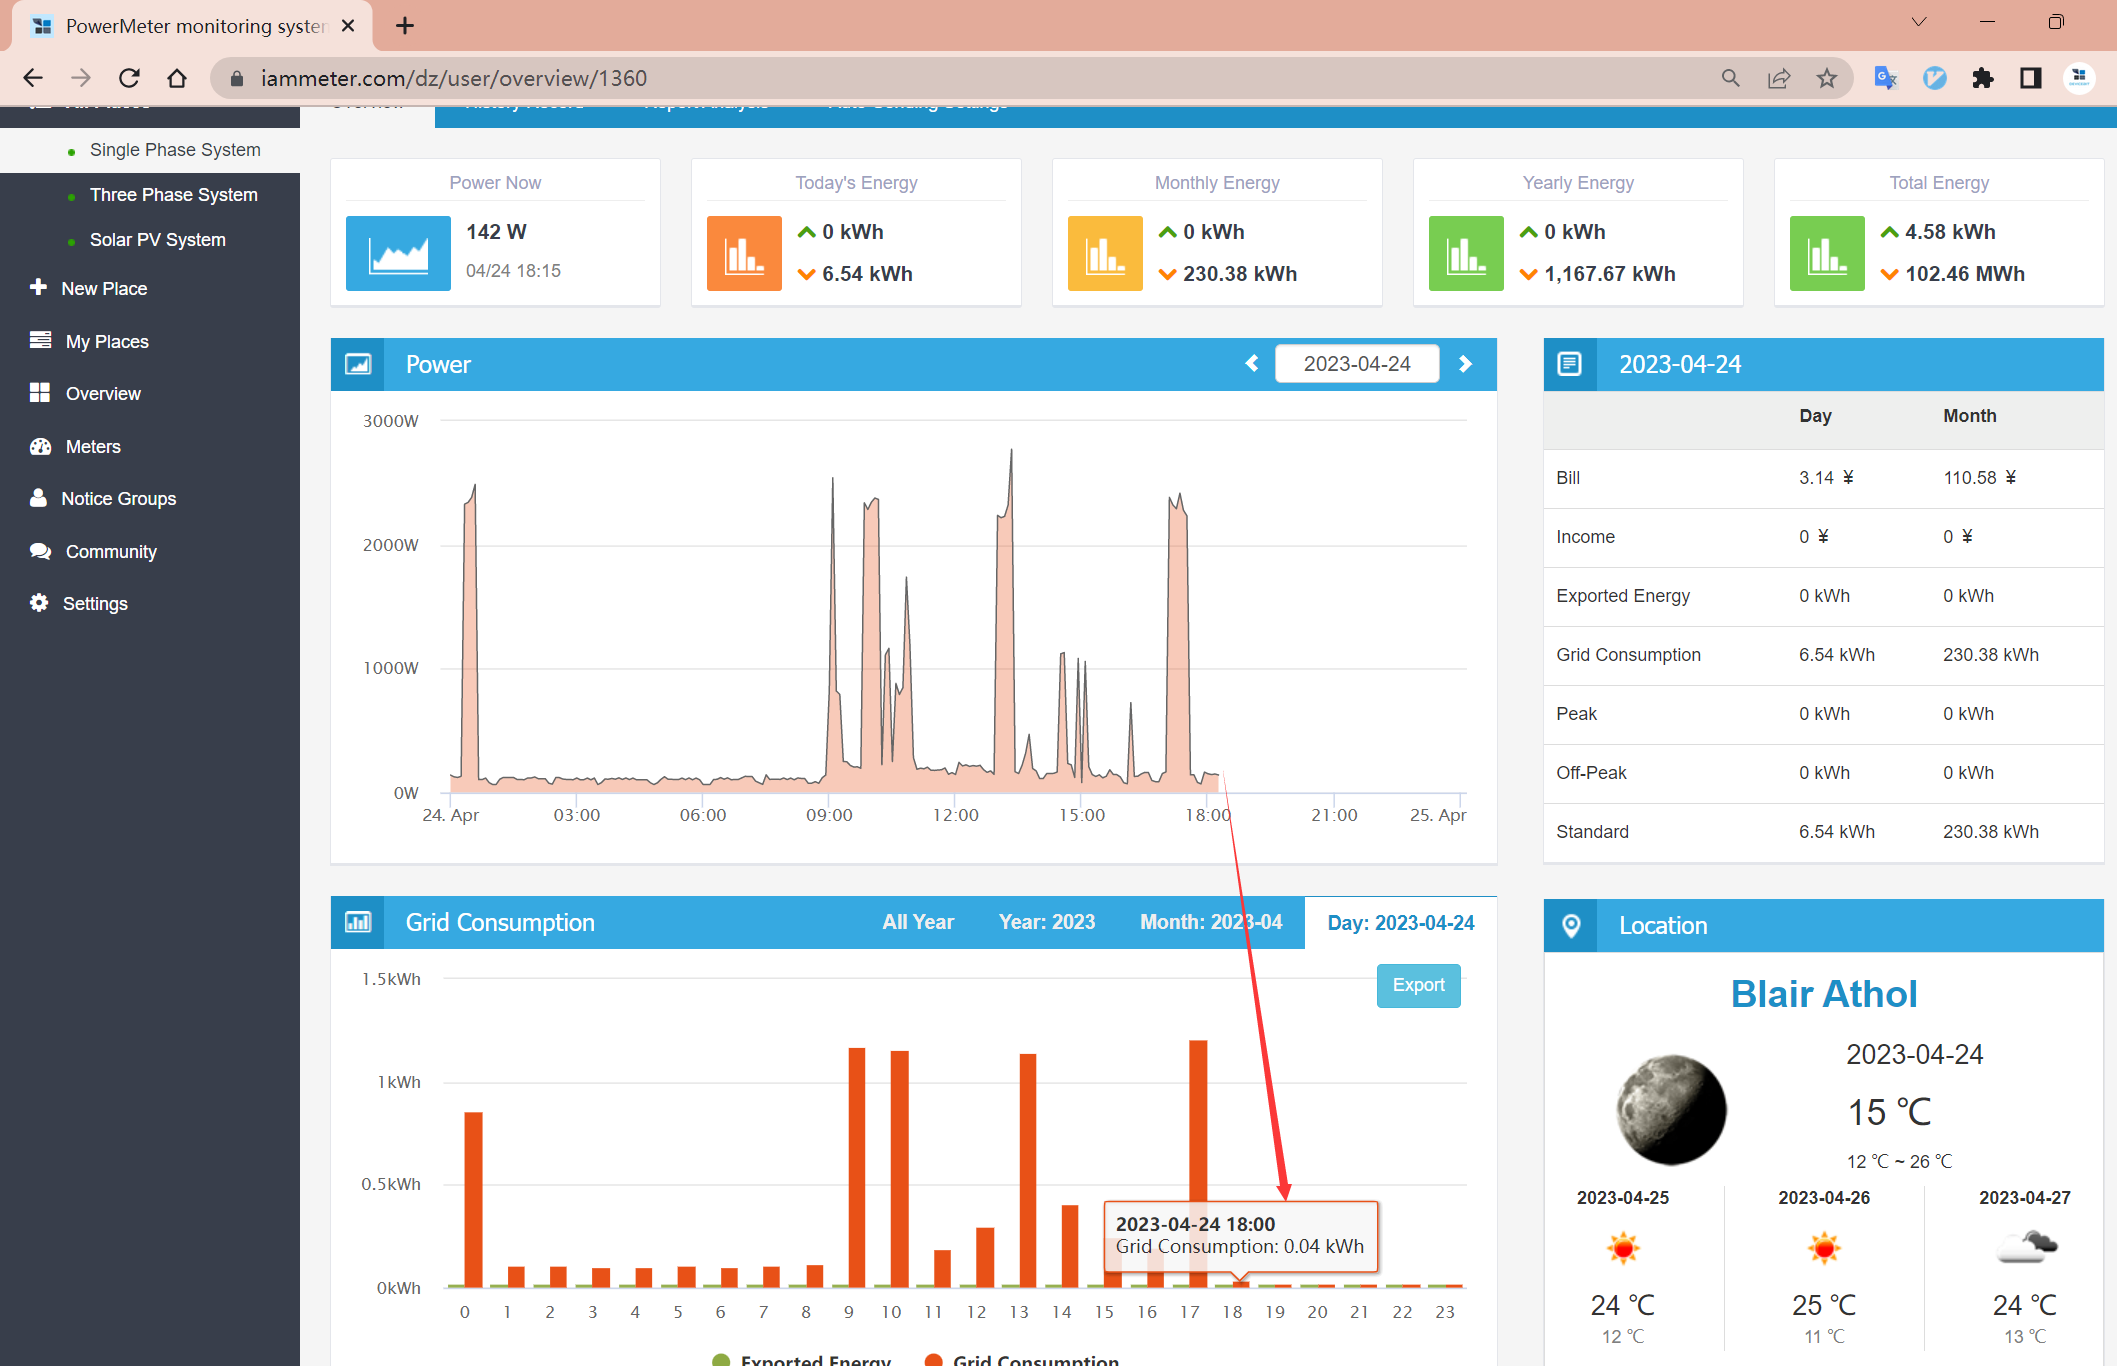
Absolutely amazing!
I never thought it would be implemented.
You guys are a very dedicated team who actually cares about their customer feedbacks.
Highly appreciate your efforts and keep up the amazing work!

