The display of data in the android app. >>> Suggestion of changes
Hi,
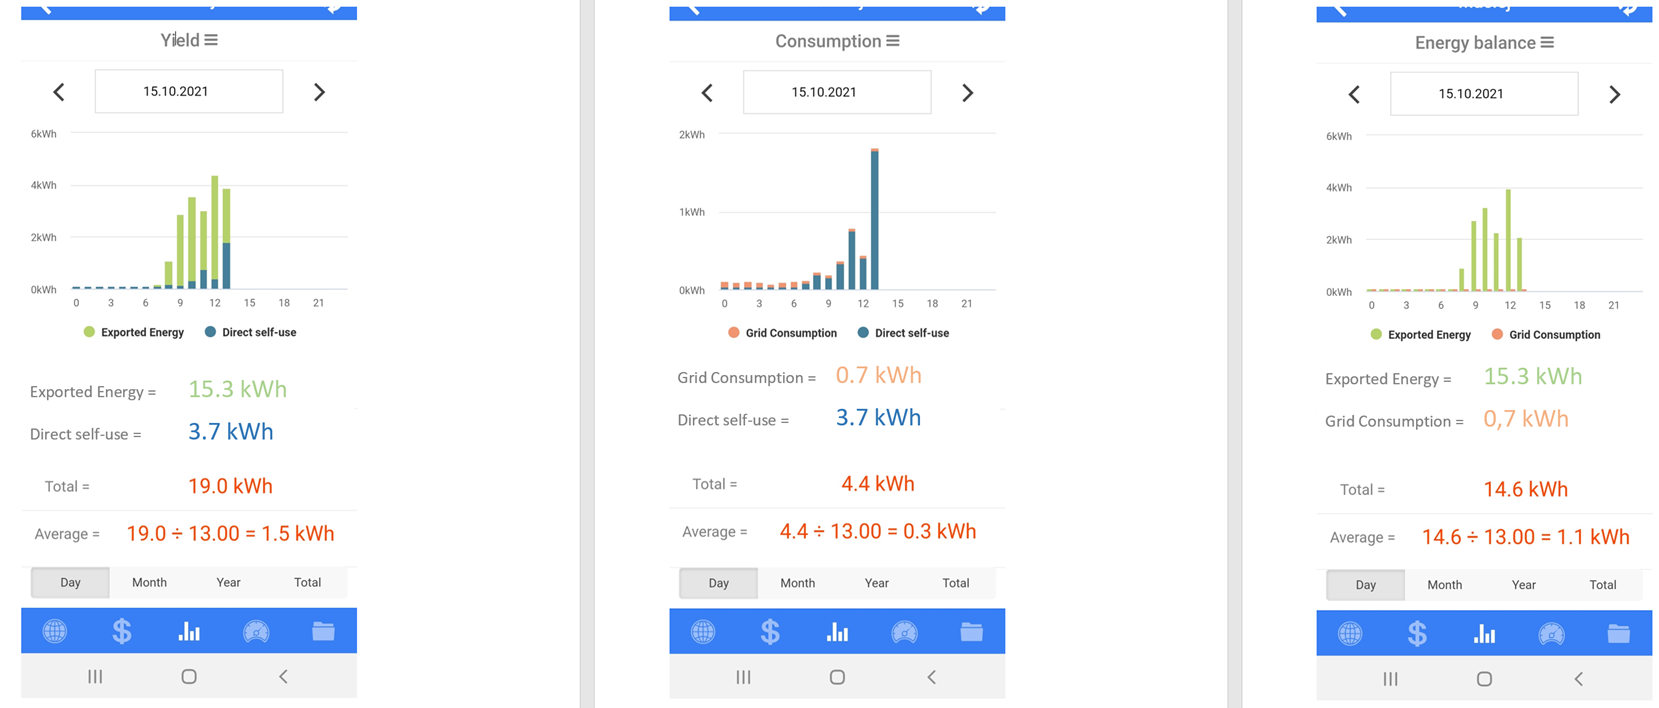
Whenever I view graphs in the app, I'm not sure what the values are. There is a total in the chart, which can be confusing at times.
Therefore, I present to you my proposal:

Hi,
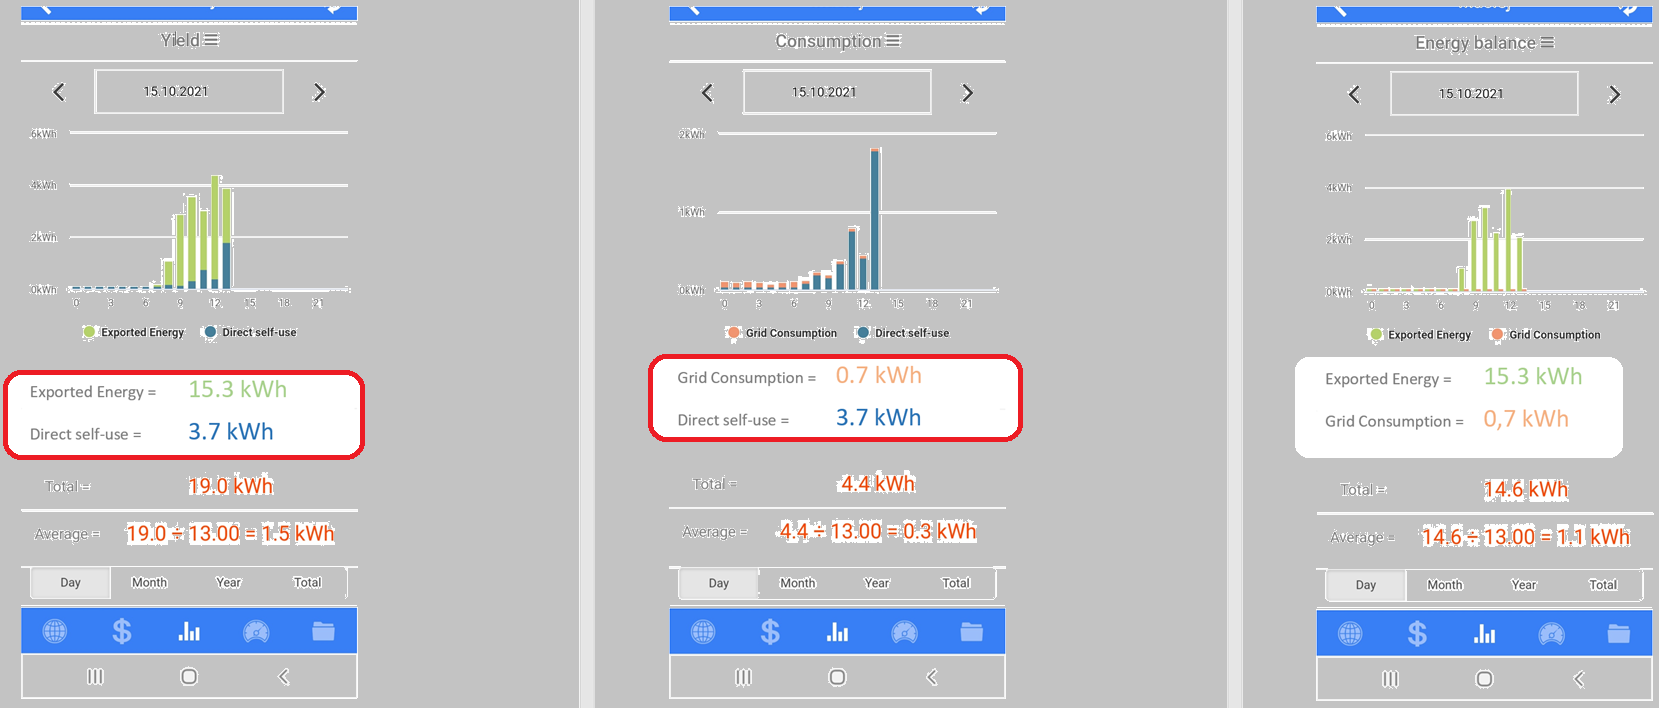
Total: The sum of all kwh/period values in this chart.
There are 13 hourly data in the chart, so the total is the sum of the 13 hourly data, and the average is the sum/13.
The logic will be the same when you review the daily monthly or yearly data.
Yes, I know, I know it all.
But you didn't understand me :) According to me, you can add detailed data, per day, per month, etc.
Thanks for your suggestion, got it.
I think this is a good suggestion and have forward it to my product colleague.
You will see this feature in our latest app upgrade.
Hi, we have just upgraded our android app for this function, please try it.
hello,
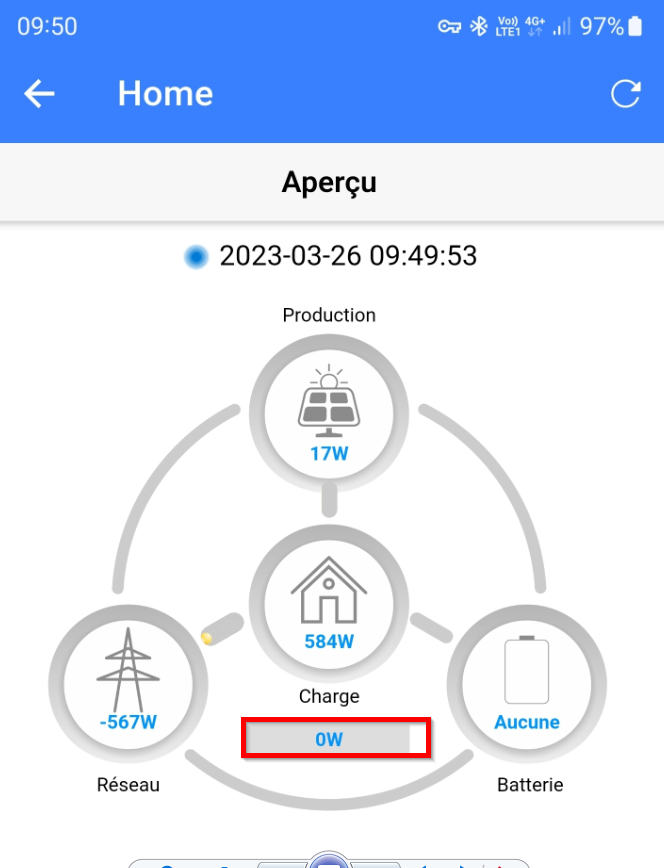
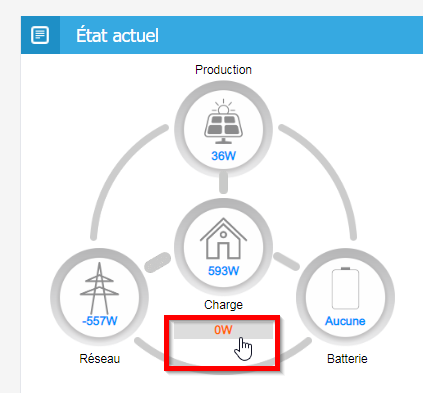
Can we also have the "special load" on android as on personal computer ?

thanks

Hi,
It's a good suggestion.
We have added it. Please check.
Good morning,
is it possible to have the same link on the special charge on android as in the PC application?
thanks ;)